Showing posts with label Power BI. Show all posts

Tuesday, April 18, 2023

Looking at historical returns of stocks and bonds with Power BI and Python

You might already have seen below graph taken from a study by JP Morgan Asset Management, but what if you would like to look at historical returns without going  through the hassle of having to collect all the data yourself?


There is an interesting Excel sheet shared by Aswath Damodaran (@AswathDamodaran)  that you can download from Historical Returns on Stocks, Bonds and Bills: 1928-2022 which looks at returns of different asset classes (stocks, bonds, bills, real estate and gold) over a longer time period.

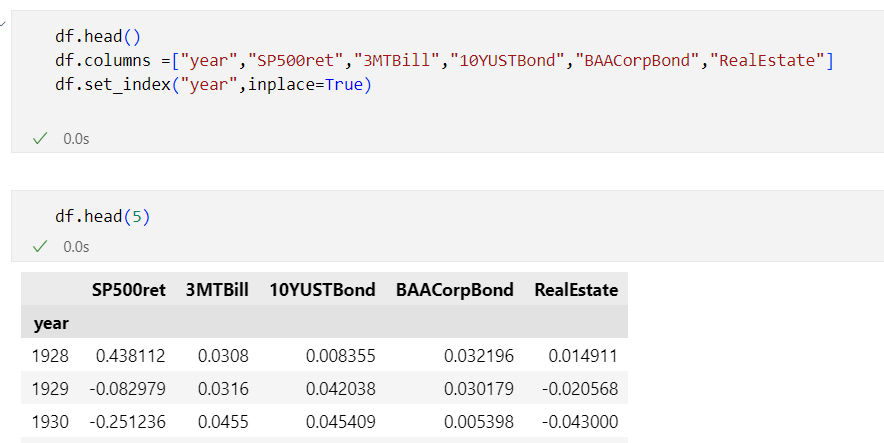
In this post I will share some tips on how you can use this data in Power BI, Python and Jupyter notebooks. 

This Historical Returns on Stocks, Bonds and Bills: 1928-2023 - Excel file  file is updated in the first two weeks of every year and it is being maintained by Aswath Damodaran, who is a professor of Finance at the Stern School of Business at NYU, he is also known as the "Dean of Valuation" due to his experience in this area.

Visualizing S&P 500 and US Treasury bond returns using Power BI

I first converted the Excel from  xls to xlsx format and afterwards it is quite easy to  import the data from an Excel workbook files in Power BI . It is quite easy to visualize the returns of  both stocks and US treasury bonds using a clustered column chart - I also added a minimum line for both stock and bond returns.

Expected risk and expected return should go hand in hand: the higher the expected return, the higher the expected risk. Risk means means that the future actual return may vary from the expected return (and the ultimate risk is loosing all of your assets). The first visual showed a 20-year annualized return between 1999 and 2018 for the S&P 500 of 5.8%.  Average returns hide however the big swings in yearly returns - e.g. in 2008 (the Great Financial Crisis), the S&P 500 had a -36.5% yearly return. Bonds on average have a lower return but also have a lower risk profile. 

The basic rule of thumb is to keep your “safe money” (i.e., money you don’t want to risk in stocks) in high-quality bonds. While this doesn’t give you 100% protection against losses at all times, it does provide you some peace of mind. I really like this quote: "If you can't sleep at night because of your stock market position, then you have gone too far. If this is the case, then sell your positions down to the sleeping level. (Jesse Livermoore)"

As you can see in the visualization below, in most years with a negative return for the S&P 500, the return for bonds is positive - with two notable exceptions 1969 and 2022. A common saying is to have your age in bonds. Using that general rule, a 45-year-old might have 45% of the total portfolio in bonds. If you want to more aggressive, you would have less than your age in bonds. The last decade with interest rates very low (or even negative) this probably wasn't a very profitable asset allocation but 
things might have shifted.
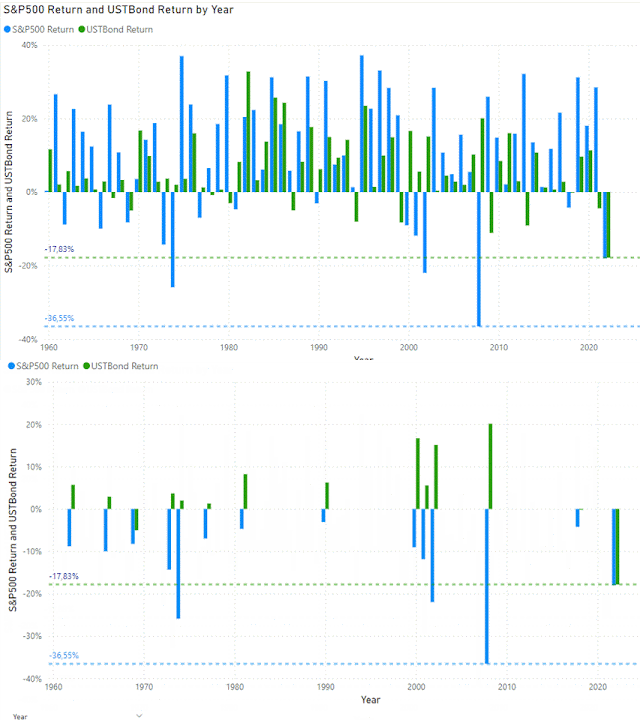


The US Treasury Bond used in the Excel file is the 10-year US treasury bond for which you can download the data from FRED . The yearly return has been calculated by taking the yield and the price change for a par bond with that specific yield.


In the long run (see example below for different rolling windows from a 1-year to a  20 year period)  stocks will outperform bonds but this again works with averages and it ignores the tail risk which might wreak havoc in your portfolio.


Reading data from Excel using Python

Now let's take a look at how you can read and manipulate the data in this Excel sheet using Python. To read an excel file as a DataFrame, I will use the pandas read_excel() method. Internally, Pandas. .read_excel uses a library called xlrd which you also need to install but I used the  openpyxl library as an alternative which also works. So before you can read an excel file in pandas, you will need to install 


The above code reads only the table with data from the Excel file (which I downloaded in a subdirectory data from the Jupyter notebook) - see  pandas.read_excel in the Pandas referencel documentation for full details:
  • sheet_name: can be an integer (for the index of a worksheet in an Excel file, default to 0, the first sheet) or the name of the worksheet you want to load
  • nrows: number of rows to read
  • skiprows: number of rows to skip
  • usecols: by default all columns will be read but also possible to pass in a list of columns to read into the dataframe like in the example

I just started exploring some data around stock-bond correlations and will be updating the Juypyter notebook on Github - https://github.com/jorisp/tradingnotebooks/blob/master/HistoricalReturns.ipynb

A couple of weeks ago I noticed this interesting tweet on rolling one-year-stock-bond correlations for six regimes from @WifeyAlpha - I think it would make an interesting exercise to see how to rebuild this using Python.


References:

Related posts:

Thursday, March 09, 2023

Dynamics 365 and Power Platform monthly reading list March 2023

 Power Platform and Dynamics 365 release 2023 wave 1

Technical topics (Configuration, customization and extensibility)


Topics for Dynamics 365 Business Applications Platform consultants, project managers and power users


Thursday, January 05, 2023

Dynamics 365 and Power Platform monthly reading list December 2022

First post of 2023 - so let's close with last month's  suggested reading list. If you want to catch up on previous reading lists for 2022 - here is the list:

 Technical topics (Configuration, customization and extensibility)

Topics for Dynamics 365 Business Applications Platform consultants, project managers and power users

Monday, November 21, 2022

Reminders for the occasional Power BI creator

I am not a regular Power BI user, but every couple of months I will create some Power BI reports (e.g., Storage capacity management for Dynamics 365/Dataverse ) because Power BI is simply great to visualize and analyze data. 


Unfortunately, I tend to forget - maybe very obvious things to frequent Power BI users - how to perform specific tasks in Power BI. 

So here it goes - my list of reminders for the occasional Power BI creator.


References:

Wednesday, November 16, 2022

Visualize S&P 500 data in Power BI using Azure Synapse Serverless SQL Pool

In Explore and analyze stock ticker data in Azure data lake with Azure Synapse serverless SQL Pool, I showed you can download stock ticker data from Yahoo Finance, stored it in Azure Data Lake and retrieve the data using standard T-SQL in Azure Synapse Studio. In this post, I will show how easy it is to consume the data from Synapse SQL Serverless using Power BI.


For the standard visual with the evolution of the S&P 500 closing price, I connected directly on SP500 external table in the Synapse SQL. You can connect to Synapse SQL Serverless using either the Azure SQL Database or Azure Synapse Analytics SQL connector and you will need to enter the Serverless SQL endpoint which looks something like this <yoursynapse>-ondemand.sql.azuresynapse.net


With the second reported I want to visualize the S&P 500 yearly return and the average return since December 1927. To make it easier, I created a separate view on top of the external table which calculates the yearly returns


As you see from the visual, returns can vary quite a lot both on the negative side as well as on the positive side - for the last 20 years, there was a huge drop in 2008 (-38%) and also this year is not looking great (-22%), but 2013, 2019 and 2021 all had returns above 20%. On average across the S&P 500 returned 7% (not included dividends).


For the last visual in the Power BI report, I wanted to show a histogram with the S&P 500 yearly returns. I based myself on Power BI Histogram example using DAX since  Power BI does not have a standard histogram and I did not want to use a custom visual ( I used Power BI custom visuals from Pragmatic Works in the past)

Equity returns roughly follow a normal distribution or "bell curve", meaning that most values cluster near the central peak and values farther from the average are less common.  Stock returns however have fat tails - meaning that the occurrences on the extremes are far more common than expected in a normal distribution.  The Greate Depression (1931) and the Global Financial Crisis (2008) led to two of the largest stock market losses of the S&P 500. With a loss between -20% and -30% this year, we are in the same category/bin as 1930, 1974 and 2002.


Sunday, September 18, 2022

Speaking engagements in coming months

With all Covid bans lifted and summer holidays well over, the conference season kicks off. 


I will be speaking at a couple of events in the coming weeks and months:

  • Dataminds evening session Upcoming in-person event on September 29th organized by dataMinds.be at Inetum-Realdolmen offices in Kontich together with Benni De Jagere. First session a little bit off the beaten track for data professionals: #dataviz for investors. Second session: #PowerBI roadmap and #AMA by Benni.
  • Collabdays Belgium 2022. Free community-driven event in Brussels, Belgium. Focus is Microsoft 365 with some Power Platform and Azure sprinkled on top. I am particularly excited to be speaking at this conference which was born out of the SharePoint Saturday conferences which I helped organize many years ago. I will be delivering Dataverse Deep Dive: watch out for sharks.
  • Cloudbrew 2022. A two-day conference focusing on all things Azure on November 18-19 in Mechelen Belgium. I will be delivering Using Python and Azure Cloud for trading and investing

Friday, July 22, 2022

Quick tip: download links for icons of Azure, Power Platform and Dynamics 365 products

If you are looking for the official collection of icons for Power Platform, Azure or Dynamics 365 that you can use in architectural diagrams or diagrams - here they are:

Thursday, June 09, 2022

Optionset support in the Power BI Dataverse connector

One of the gotchas of using Power BI to build reports for Dynamics 365 CE (or Dataverse) has been how to easily handle optionset columns (or choice columns as they are now called in the new Dataverse terminology). You had to use work arounds to display the optionset labels as explained in Using Power BI Desktop to build Dynamics CRM Online reports part 4 (article dating back to 2015).

As outlined in Create a Power BI report using data from Dataverse - choice columns are now handled out of the box e.g. in the account table you have a choice (optionset) column called "industrycode" - in Power BI you will now see two columns - "industrycode" (the integer value) and "industrycodename" (the friendly display name of the item)


Also consider the warnings outlined on the official Microsoft documentation though - filtering by choice value can have a performance impact and you also need to make sure that all customizations in Dataverse have been published.

Related links:


Wednesday, March 09, 2022

Dynamics 365 and Power Platform monthly reading list February 2022

2022 Release Wave 1

Technical topics (Configuration, customization and extensibility)

Topics for Dynamics 365 Business Applications Platform consultants, project managers and power users

Tuesday, February 01, 2022

Quick note - refer to previous row in Power BI

 A number of good tips in this video on how to refer to a previous row in Power BI - I am not a Power BI expert but it got the job done - I just wanted to visualize Dataverse storage growth from one day to the next.


The grey area shows the forecast for the storage increase/decrease - for more info see Use the analytics pane in Power BI and  Introducing new forecasting capabilities in Power BI for Office 365 (dated but still relevant).

Tuesday, October 27, 2020

Improve your quality assurance using the Power Platform webinar

On November 3th, the Realdolmen Power Platform team organizes a free webinar on how you can leverage Power Apps, Power Automate and Power  BI to support quality assurance processes.

Improve your quality assurance using the Power Platform webinar registration link (November 4th  - 14:00-15:15 CET) .

Session description: With low-code platforms being a trendy topic of 2020, chances are that this isn’t your first invite for a webinar on this topic. But how about a real use-case in action? Let us show you a practical approach on how to combine the ease of use of the Power Platform with common Quality Assurance tasks. We take you through the process of digitizing a paper process for quality assurance, automating manual tasks to optimize efficiency and displaying interactive overviews for audit purpose.

Friday, October 23, 2020

Understanding Dynamics 365 Power BI Template Apps vs Power BI Content Packs

Content packs were used in the past to package and share Power BI objects like datasets, reports and dashboards.  Microsoft initially also used content packs to build their own Dynamics 365 solution templates, these solution templates were made available on Microsoft AppSource

But in 2019, Microsoft introduced the concept of Power BI template apps (See Announcing Power BI template apps general availability) - this also meant that all previous content packs/solution templates became deprecated and some of them got replaced by the template app experience.  

Microsoft indeed converted some of the Dynamics 365 content packs into modern Power BI apps and published the updated Power BI apps for Dynamics 365 platform to the Microsoft AppSource.  Some of these Power BI apps are tied to a specific Microsoft first party app like Sales Analytics for Dynamics 365 Sales, others can be used by multiple first party apps like Process Analytics for Dynamics 365.


Microsoft partners  also build their own Power BI apps for the Dynamics 365 platform and published these to  Microsoft AppSource e.g. Microsoft Customer Engagement - Sales Analytics from FuturIT 

It is  important to understand that you can not modify the Power BI Template Apps easily - the pbix files which drive these Power BI Apps are not downloadable so you can not change the standard reports delivered with these Power BI Apps. Users can however change some parameters in the web view - see Let users personalize visuals in a report - this is however on a per user basis. I however was looking for a way to modify the reports in a similar way which was possible with the content packs.


The workarounds that my colleague @bennidejagere suggested for exporting the underlying model using the XMLA endpoint in Power BI is a little bit out of my comfort zone and does not allow me to get at the report files so I looked at little further.

However the existing solution templates from Microsoft were moved to open source end 2018 (See Power BI solution templates moving to open source) and added to the BusinessPlatformApps github repo. Microsoft however stopped maintaining the original reports but you can still find the original Power BI reports which were part of these packs. 

Important: The Power BI template apps for Dynamics 365 Sales and the Process Analytics for Dynamics 365 are also available for download from the Microsoft site on Customize Power BI template apps for Dynamics 365

References:

Thursday, August 13, 2020

Quick tip: SQL access to Common Data Service using Tabular Data Stream (TDS)

Recently Microsoft announced Power BI DirectQuery support (in preview) to the Common Data Service (CDS)  using Tabular Data Stream. You can also leverage this  CDS TDS endpoint within SQL Server Management Studio to write SQL queries against the CDS database. You can connect using the base url of your CDS instance and add the port 5558. To authenticate you will need to use Azure Active Directory - Password.


By default this functionality is not enabled, so you if you try to use SQL Server Management Studio you will get below exception.

As outlined on http://aka.ms/enablesqlforcds, you will need to to go the Power Platform Admin Center to switch on the TDS support.

References:


Tuesday, May 19, 2020

Dynamics 365 and Power Platform monthly reading list April 2020

Dynamics 365 and Power Platform -2020 Wave 1 Topics

Technical topics (Configuration, customization and extensibility)
Topics for Dynamics 365 Business Application Platform consultants, analysts, project managers and power users

Monday, April 27, 2020

Things to watch out for when configuring the export of CDS data to Azure Data Lake

End October 2019 Microsoft announced general availability of the export to Azure Data Lake functionality  (previously called Project Athena) for CDS and Dynamics 365 (Sales, Customer Service and Field Service).


It is quite easy to setup by following the steps outlined in the announcement blog post  or the official documentation on exporting entity data to Azure Data Lake Storage Gen2 - there are however two important prerequisites:


  • The login that you use to configure the Export to Data Lake settings needs to be an owner of the Azure storage account. If you missed this step you will get an exception in the configuration wizard on the second screen.


References:

Tuesday, December 31, 2019

Dynamics 365 and Power Platform monthly reading list November 2019

Technical topics (Configuration, customization and extensibility)

Topics for Dynamics 365 Business Application Platform analysts, project managers and power users

Monday, October 21, 2019

Using Twitter analytics data in Power BI – Part 1

I have been using Twitter for over 10 years but I never paid a lot of attention on engagements or impressions statistics but after listening to the Microsoft flow with Jon Levesque podcast  from @nz365guy I decided to take a look at what are drivers for more impressions or engagements on my Twitter account. So I decided to create some Power BI reports based on Twitter activity exports.


I only used Power BI in proof of concepts up until now so this was a good opportunity my Power BI skills which got a little bit rusty after not using it for more than a year. To get started I first exported my tweet activity report in CSV format from Twitter Analytics  (I did it manually but there is a REST API available as well). Next I combined the different CSV files while loading it into Power BI (I followed these instructions - How to load data from a folder in Power BI). After the usual data cleansing (remove unused columns, rename columns, setting appropriate date types) and data transformation I started extending the data model. Since I also wanted to know whether there is a difference in engagements/impressions based on the day of the week the tweets was sent, I created a custom date dimension. Power BI creates a default date dimension as well but I decided not to use this – see Power BI Date Dimension: Default or Custom? Is it confusing? for more info.

I also wanted to remove the urls/hyperlinks from my tweet text before building up a word cloud with the most common terms. Luckily Power Query supports some interesting transformation, you can temporarily transform a text into a list using Text.Split(text, “”), perform operations on each word and then reassemble it again using Text.Combine(list, “ ”)  (Trick found on Multiple replacements or translations in Power BI and Power Query)


I used a similar trick to found out the number of hashtags used in a specific tweet.


The Power BI report is still a work in progress but if you already want to have a temporary copy - DM me on Twitter

References:

Monday, March 25, 2019

Dynamics 365 monthly reading list March 2019

Technical topics (Configuration, customization and extensibility)

Topics for Dynamics 365 CE business analysts, project managers and power users

Friday, February 22, 2019

Making sense of XRM, PowerApps and some other acronyms (CDS, CDM, …)

With the July 2018 update of Dynamics 365 (9.0), Microsoft released an interesting architecture update to Dynamics 365 Customer Engagement where they separated the “core” features of the platform and the various business modules (Sales, Customer Service, Marketing, Field Service, etc…). This separation of the “core” platform features allows not only Microsoft Business Applications to leverage the platform capability but also third party providers and ISVs.

The term XRM  was used in the past to describe the ability to built business applications with minimal development effort (relying on configuration and customization) on top of the Dynamics CRM platform. These applications allowed you to model business entities and their relationships (xRM or any Relationship Management) and keep track of this information in a database without having to develop everything yourself. With the platform separation, we can now finally think about XRM and CDS in the same way (check out Yes, XRM is the new Common Data Service (2.0) by @Jukkan for more information).


From a solution architecture perspective we can see a number of main building blocks in the schema above:
  • Common Data Service (CDS)
  • Power Platform
    • Power BI -  interactive data visualization platform 
    • PowerApps – allows you to build canvas driven apps and model driven apps. Canvas driven apps  are apps that you can build using  a drag and drop design interface without requiring a developer - especially very productive to built mobile/tablet applications. Model driven apps also allow you built business applications without requiring a developer but unlike canvas apps you don’t have full control on the user interface but with additional functionality such as process support, full extensibility, etc … This was previously referred to as the xRM capability – sometimes also referred to as CDS for Apps. Initially PowerApps was a completely separate platform but with the Spring 2018 update Microsoft decided to merge the two different platforms. Read PowerApps Spring Update – if you want to get your heads around the new CDS for Apps and to understand how everything seems to finally come together. Definitely also subscribe to the PowerApp blog to keep up to date on the fast pace at which this platform is evolving. Microsoft is on a weekly release schedule for PowerApps which is also visible in the Released versions of Microsoft PowerApps
    • Flow  - an easy to use workflow and integration platform. A power-user can use this platform. Programming skills are not mandatory  https://flow.microsoft.com/en-us/ . With over 250+ connectors and a huge number of templates, Microsoft Flow allows you to automate your daily work.
  • Azure – Microsoft’s cloud platform powering all of the above. The Power Platform as well CDS for Apps also have built-in capabilities to integrate with a lot of Azure building blocks – an interesting read on this topic is https://powerapps.microsoft.com/en-us/blog/create-business-apps-using-powerapps-and-azure-functions/

I had a number of interesting conversations with Microsoft about the Microsoft Power Platform when attending the Microsoft Fasttrack bootcamp for solution architect in January 2019 which convinced me that this is not something that you can dismiss as a Microsoft Dynamics partner. The future toolkit for customization and extending Dynamics 365 CE will be PowerApps and Flow. But it seems that non-Dynamics partners are amongst the first movers to take a large part of this new market opportunity. As a Dynamics 365 partner (or consultant) take a look at Why Microsofts Power Platform is one of its biggest bets for 2019 which explains where Microsoft is moving to and how they plan to leverage the data captured in the Power Platform/CDS to provide more actionable insight - see https://aka.ms/allaboutbase

"The true value of Microsoft Business Applications platform is the ecosystem it resides in, the 
AI signals (internal and external) that enrich it, and the overall 
outcomes it creates for your business."


Background information: