Monday, May 23, 2022

The answer to every licensing question is 42

The answer to life, the universe and everything else is 42 (check out The Hitchhiker's Guide to the Galaxy if you want to know where this comes from), so when a customer asks a question about Dynamics 365 and Power Platform licensing, I would also like to just be able to answer 42.


Having worked with Microsoft products for over 20 years now,  the single constant seems to be that Microsoft licensing is in a continuous state of flux. This is especially true for cloud platforms so  make sure that you involve the necessary experts  to help you in making the correct decisions and keep you up to date. 

In this blog post I am trying to shed some light on some interesting licensing updates for Microsoft Dynamics 365 and the Power Platform. I will also provide  some links to excellent posts/videos from other community members - this is by no means an exhaustive list.

Power Platform and Dynamics 365 request limits and allocations

I recently wrote a blog post about the Update to Power Platform and Dynamics 365 request limits and allocations . Microsoft has finally released a preview of the Power Platform requests reporting in May 2022. 


As noted in the official docs - What are the timelines for Power Platform Request limits? - enforcement of these limits will be activated at least 6 months after reports have been made GA.  In my opinion, things like requests limits and allocations are quite hard for customers to understand and also difficult to design for.


Pay as you go licensing for Power Platform

In March 2022, pay-as-you-go licensing for Power Platform reached general availability. With apay-as-you-go plan, customers can use an Azure subscription to pay for Power Apps based on active usage of the apps instead of purchasing and allocating licenses in advance. If you compare the unit pricing you will see that for similar workloads - the pay-as-you-go licensing price per unit is higher. So this will make an interesting balancing act for customers.


Scenarios combining Microsoft Teams and Dynamics 365

Don't get me wrong; I am really excited about the integration scenarios between Microsoft Teams and Dynamics 365 but announcements like Bring Dynamics 365 into the flow of work with Teams - at no additional cost generate a lot of excitement with customers but once you try to implement it you will notice that users do need a Dynamics 365 team member license. Be cautious and take big announcements with a grain of salt and always validate them yourself. When a user has a valid Dynamics 365 license, you are now able to view and edit Dynamics 365 records inside Microsoft Teams. 

Integration scenarios with Microsoft Teams are a great feature but the obscurity of Microsoft licensing around this, makes the discussion for consultants harder than needed. 

References:


Thursday, May 19, 2022

Using Python and Pandas Datareader to retrieve financial data - part 2: Fama & French data library

This post is part of a series on using Pandas datareader to retrieve financial data:

In this post we will look at the datasets made available by Eugene Fama and Kenneth FrenchEugene Fama and Kenneth French did a lot of research on which factors drive security returns. In 1993, they published the Three Factor Model (see article "Common risk factors in returns of stocks and bonds", Journal of Financial Economics 33, 1993), which showed that their factors (size of the firm, book-to-market values and excess return) capture a statistically significant fraction of the variation of stock returns. In 2014, Fama and French adapted their model to include five factors.  Fama won the Nobel Prize for Economics in 2013 for his research. Fama also published a number of papers on the Efficient Market Hypothesis and random walk theory.


Fama and French still publish the returns of various investment factors analyzed by them on their homepage on a regular basis.  You can download this data using the pandas_datareader library - you can take a look at the official documentation,  Fama-French Data (Ken French's Data library) to get started or take a look at the Jupyter notebook that I shared on Github https://github.com/jorisp/tradingnotebooks/blob/master/FAMA.ipynb


References:


Monday, May 16, 2022

Large AsyncOperationBase increase in Dataverse/Dynamics 365 CE: the canary in the coalmine

In normal circumstances, you probably rarely look at the System Job views in your  Dynamics 365 environment. But if you see a sudden and unexpected (large) increase in the storage used by the AsyncOperationBase table or AsyncOperation in File storage is like a canary in the coalmine - something is wrong in your Dynamics365/Dataverse environment.


System jobs (or Async Operations) are tasks that Dynamics performs in the background that don't have to be completed straight away. When such an asynchronous task is being setup, Dynamics creates a row in the AsyncOperationBase table and puts in all the details about when to run, what function/plugin/cloud flow to call, parameters to pass etc... 

All of this information used to be stored in columns of the AsyncOperationBase table but a row could  get really large (KB or MBs) depending on the actual task being scheduled.  Part of this payload has now been moved out of the database and stored into files on Azure Blob Storage and the database row now has a reference to the blob file.  You can follow up on the numbers in the capacity details for an instance in the Power Platform Admin Center (PPAC) - where you will now also see AsyncOperation in the file section after this architectural change from Microsoft. (Also see Storage capacity management for Dynamics 365/Dataverse - how to track storage evolution with Power BI and New Microsoft Dataverse storage capacity (Microsoft docs))


Dynamics 365 has a recurring system job to delete successfully completed system jobs  - see screenshot below - when an asyncoperation record is cleared from the database, the linked file storage is also cleared up.


One of the reasons you might see a large increase in storage consumed is because of a large amount of failed or cancelled system jobs.  The system jobs status (internal name statecode, possible values = ready, suspended, locked and completed)  and status reason ( internal name statuscode, possible values for completed jobs = succeeded, cancelled and failed)  can be used to identify possible issues.

I really like the SQL 4 CDS XrmToolBox add-in to troubleshoot issues with system jobs - it allows you to write simple SQL queries to identify system jobs causing issues. 

I also use  SQL4CDS for further analysis when troubleshooting async plugins using SQL queries e.g. select top 100 * from plugintracelog where typename like 'JOPX.CRM.Plugins.Notification%' but there are also other tools in XrmToolBox which you can use


Wednesday, May 04, 2022

Using Python and Pandas Datareader to retrieve financial data - part 1: Federal Reserve Data (FRED)

The pandas-datareader Python library covers a number of APIs with global fundamental macro- and industry data sources including the following (for a full list see  Pandas Datareader - data sources ):

  • St. Louis FED (FRED): Federal Reserve data on the U.S. economy and financial markets
  • Fama/French data library : market data on portfolios capturing returns on key risk factors like size, value, and momentum by industry
  • Yahoo Finance : retrieve daily stock prices, historical corporate actions (dividends and stock splits) from Yahoo Finance 
  • World Bank: global database with economic/social indicators and demographics.

This post is part of a series on using Pandas datareader to retrieve financial data:

In this post I will focus on retrieving data from FRED using pandas-datareader.  Federal Reserve Economic Data (FRED) - https://fred.stlouisfed.org/  is a database maintained by the Federal Reserve Bank of St. Louis. It has more than 800.000 data time series covering categories such as Economic growth & employment, monetary & fiscal policy, demographics, industries, commodity prices at different frequencies (daily, monthly, annual).  One of the interesting time series you can find here are 3-month Treasury Bill Secondary Market rate (TB3MS) or 1-year US Treasury bills which are used a proxy for the risk free rate in financial modeling. 


There is however some missing data on the TB1YR - so I will be using the TB3MS (3 Month) in my next example. You will notice that all time series are identified by a short abbreviation that you can find by searching on the FRED website.


References:

Monday, May 02, 2022

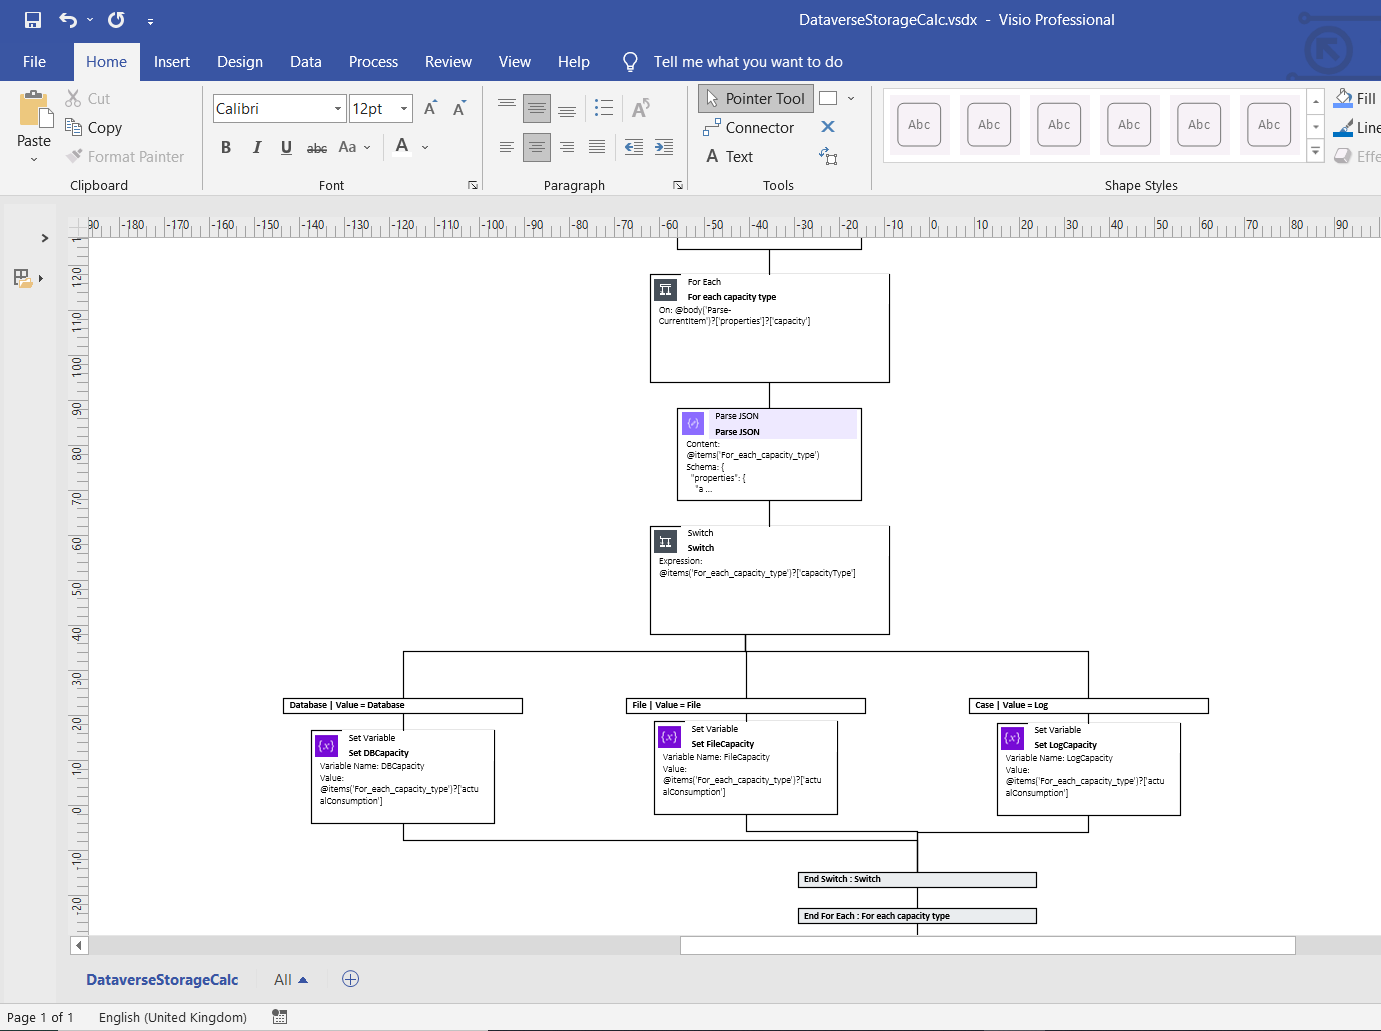
Documenting Power Automate Flows with Flow to Visio XrmToolBox Add-on

Last year I needed to document some rather complex Power Automate cloud flows and that's when I stumbled upon this great tool from Carl Cookson (aka @LinkeD365): the Flow to Visio XrmToolBox add-on. This XrmToolBox addon - XrmToolBox is the Swiss army knife for CRM  and Power Platform) consultants, check out https://www.xrmtoolbox.com/ for more info -  allows you to generate a Visio diagram for Power Automate Flows and Azure Logic Apps. Being able to generate Visio documents for Power Automate Flows is a great way to automatically generate a starting point for documentation. 

When you connect to a Dataverse instance, it will show you all of the different cloud flows. You can select one or more flows and simply click "Create Visio".


What I especially like about this tool that since the documentation is generated in Visio you can still clean up the output or remove parts of the flow in the Visio document which don't require explanation.


Note: You also might want to take a look at PowerDocu which contains 2 console apps you can use to document Power Automate Flows as well as Power Apps Canvas Apps

References:


Friday, April 29, 2022

Dynamics 365 and Power Platform monthly reading list April 2022


2022 Release Wave 1

Technical topics (Configuration, customization and extensibility)
Topics for Dynamics 365 Business Applications Platform consultants, project managers and power users

Friday, April 08, 2022

Reading and writing files in Azure Blob Storage with Python

Azure Blob storage is Microsoft's object storage solution for the cloud and allows you to store massive amounts of unstructured data, such as text or binary data at low cost for every scale. If you are not familiar with it, I can recommend taking a look at the Store data in Azure learning path on Microsoft Learn

Using Python in combination with Azure Blob Storage is quite easy using the azure-storage-blob client library for Python . You can set up a container with private access meaning that you will need to provide credentials to access the containers and the blobs contained within. The easiest way to do this is using a shared access signature (SAS) token. You can generate a SAS token from the Azure Portal.


To interact with the different parts of Azure  Blob Storage you will typically use the BlobServiceClient to work with the Azure storage account itself, the ContainerClient to work with a specific container and the BlobClient to work with a specific blob.  Below is the sample code which uses these different clients in a Jupyter notebook (based on Quickstart: Manage blobs with Python v12 SDK)   - you can find the full Jupyter notebook at tradingnotebooks/AzureBlobStorage.ipynb at master · jorisp/tradingnotebooks (github.com) 


 References:

Wednesday, March 23, 2022

Recreating an Azure Synapse Link for Dataverse connection

If you encounter an exception during the initial setup of Azure Synapse Link for Dataverse, it is best that you check in Azure Synapse workspace whether the lake database was only partially created. When you want to retry the configuration, you will first need to remove the lake database. 

Previously you had to manually write a script but Microsoft has now added a handy delete button which will generate an Azure Synapse Analytics notebook for you. To be able to run the script you will however need to setup a serverless Apache Spark pool


The smallest default configuration (4vCores/32GB) is sufficient to run this notebook - double check the pause settings of the Spark pool after the initial setup or just delete the pool if you don't to expect to need it anymore afterwards to save costs. 


Other blog posts on Azure Synapse and Dataverse:

Thursday, March 17, 2022

Storage capacity management for Dynamics 365/Dataverse - how to track storage evolution with Power BI

After the introduction of the new storage management model in Dataverse in April 2019, both Dataverse and Dynamics CRM Online are using a tiered storage model (separation between database capacity, file capacity and log capacity). 

Based on the number of licenses acquired, every customer has a specific storage capacity entitlement - you can find an overview of storage consumption within the Power Platform Admin Center - section 1 shows an overview of all storage types consumed across all environments (support and trial instances are excluded), section 2 shows the allocated capacity based on number of licenses or purchased additional capacity and section 3 shows the biggest environments. 


To see where Dataverse storage is being used across your environments, you need to click on the second tab. From this page you are also able to download a CSV file with storage allocations for all environments to which you have access. The information on this page is updated every 24 hours and unfortunately no historical data is available so it is quite hard to track storage evolution.


I currently track the evolution of storage by downloading this CSV file and storing the exported file on SharePoint - then it is quite easy to use Power BI to combine the CSV files and create your own Power BI report and dashboard based on the storage details. I added a screenshot of one of the report pages below, for those of you interested in this Power BI report send me a DM on @jopxtwits 


References:

Wednesday, March 09, 2022

Dynamics 365 and Power Platform monthly reading list February 2022

2022 Release Wave 1

Technical topics (Configuration, customization and extensibility)

Topics for Dynamics 365 Business Applications Platform consultants, project managers and power users

Thursday, February 03, 2022

Dataverse environmentid vs organizationid

Coming from a Dynamics CRM background, I mainly used the organizationid in the past (the organizationid is the unique identifier associated to a CRM instance). So having to use both organizationids and enviromentids isn't always easy,  and sometimes I still mix the two  - readability isn't a trait of GUIDS ... 


First some background on why we have two identifiers. With the July 2018 update of Dynamics CRM (version 9.0) Microsoft separated out the core platform features and the various business modules (Sales, Customer Service, etc...)  and this was also the point in time where CRM consultants where suddenly faced with a second identifier for a Dynamics CRM instance - the environmentid.

To find both the environmentid and organizationid of an instance, you open up the maker portal and select the developer resources link in the settings menu for an instance.


From this page you can find both the environmentid and organizationid - the Microsoft documentation still points to the legacy interface - Determine your environment's organization ID and name which starting from the maker portal requires quite a few additional steps ...

Tuesday, February 01, 2022

Quick note - refer to previous row in Power BI

 A number of good tips in this video on how to refer to a previous row in Power BI - I am not a Power BI expert but it got the job done - I just wanted to visualize Dataverse storage growth from one day to the next.


The grey area shows the forecast for the storage increase/decrease - for more info see Use the analytics pane in Power BI and  Introducing new forecasting capabilities in Power BI for Office 365 (dated but still relevant).

Wednesday, January 26, 2022

Azure DevOps - historical graph for agent pools (Preview)

If you want to catch up with all features/improvements released  on Azure DevOps - you can take a look at the Azure DevOps Feature timeline. One of the cool features which went in preview in December 2020 is the historical graph for agent pools (Preview) - which is extremely useful if you are working with a large team of developers and you need to know whether you need to add additional build agents. Microsoft recently updated the documentation on Historical graph for agent pools (Preview) | Microsoft Docs .


References:


Tuesday, January 25, 2022

Update to Power Platform and Dynamics 365 request limits and allocations

Microsoft updated the Power Platform and Dynamics 365 request limits and allocations (also referred to as entitlement limits) end of last year and upped the allocated limits significantly, which is great news. At the same time Microsoft also announced their planning on enforcement of the API request limits and availability of reports to track the number of API calls at tenant level (reports expected in first quarter of 2022 - long awaited since it first announced in 2019) 

All table/entity CRUD operations - both calls that originate from internal and external sources will count towards a tenant level allocation of requests in a 24 hour window. If you go above this allocated limit you are expected to buy additional API licensing packs. 

Especially external integrations and/or business logic (even plugin executions count against these limits) might cause spikes in API calls but so far not a lot of attention was paid to it especially since the limits are currently not enforced. 


These integrations typically use non-licensed users ( e.g. application users, non-interactive users, administrative users or System) also consume allocated API requests and this is where you will need to pay more attention - especially in environments with relative high integration volume and low volume of fully licensed users.

So let's take an example to illustrate the increases in default allocated API capacity - suppose you expect 1 million API calls in a 24 hour period in your tenant and you have 100 users with Dynamics 365 licenses in your environment - then you either need to purchase a number of licensing packs - list price +/- 50€ per month per pack (but I recommend reaching out to your licensing partner to get an up to date quote) or use the new Pay as You Go subscription model which is currently in preview. 


The available capacity has been upped quite significantly with allocated base capacity now at 500.000 API calls (previously 100.000 API calls) and an additional 5.000 calls per licensed Dynamics 365 user (see Non-licensed user request limits  for details and exceptions). Also the number of API calls per licensing pack has increased to 50.000 (previously 10.000)

The list price of the licensing pack which I found seems to be 50€ per month per pack (I would recommend reaching out to your licensing partner to get an exact price) which seems to be similar to the price in the past if my memory serves my As part of the pay as you go model there will be a separate meter available - see Pay-as-you-go meters - Power Platform requests.

Currently you can only view the number API requests in the Power Platform Admin Center (PPAC) on a per environment basis in the dashboard for Dataverse API call statistics - if you can't wait for the new reporting to become available I would recommend starting from this one to get an indication of number of API calls.


References:


Friday, January 14, 2022

Dynamics 365 and Power Platform monthly reading list January 2022

2021 Retrospective

Technical topics (Configuration, customization and extensibility)

Topics for Dynamics 365 Business Applications Platform consultants, project managers and power users

Friday, January 07, 2022

Notes and links for the AZ-900 Azure fundamentals exam

As a Microsoft CRM technical consultant/developer/architect you should have at least a basic understanding of Azure Cloud and how you can combine Dynamics 365 CE and Azure. 

Although I have been using Azure Cloud together with multiple Dynamics 365 Customer Engagement projects since 2015 I thought it was a good idea to check my overall understanding by doing the AZ-900 exam (which I passed). The exam does not cover any topics in depth but studying for it gives you a good overview and can be used as a starting point to delve deeper in specific topics;


Listed below are some of the links and resources that I used - mainly on topics where I had less hands-on experience from projects so this is definitely not an exhaustive list. 

General training material to get started

Architectural components
Management tools
Security and identity management
Networking

Governance and compliance

Thursday, December 30, 2021

Virtual tables in Microsoft Dataverse and Dynamics 365 Customer Engagement

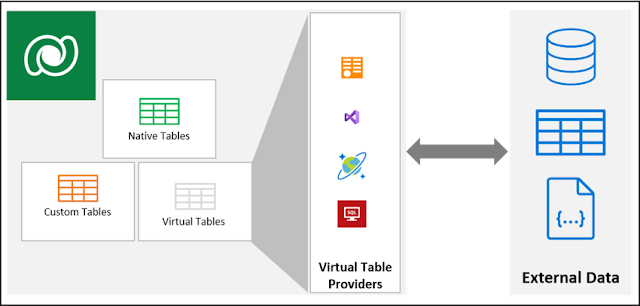
Virtual entities in Dynamics CRM have been around for more than 4 years and were introduced with the 9.x release of Dynamics CRM Online. Virtual tables (entities) allow you to integrate external data into Dataverse without having the replicate the data or without having to write client side script to visualize the data. Virtual tables provide an abstraction layer which allow for real-time on-demand access to data wherever it resides, for end users it will look as if the data resides in Dataverse.

To be honest, I hadn't paid a lot of attention to virtual entities due to its limitations and due to the fact that there weren't  a lot of improvements from Microsoft in it before 2021 - some of these limitations of virtual tables still exists like only organization owned tables, no auditing or change tracking, no queue support, a virtual table cannot represent an activity, etc...  But a lot has changed in the last 12 months - for example CRUD support for virtual table providers went GA in March 2021 so I decided to take a look at it in the last couple of days.  Another trigger was a blog post from @jukkan on Virtual Dataverse tables with no code, via Connectors which I marked already marked for review a couple of months ago.

Virtual Table Data Providers act as the glue between the external data and your virtual entities in Dataverse.  There are currently  4 different flavors of the Virtual Table Data Providers: oData, custom-built using plugins, Cosmos DB and using the Power Platform Connector for SQL with a number of them still in preview.


Dataverse ships with an OOTB OData v4 Data Provider but I personally haven't seen any practical use case for this specific connector. So let's take a look at the current status of the 3 other data providers.

Custom Virtual Data Provider
This is really a pro-developer story, .NET developers have the option of creating custom virtual table data providers to help integrate external data source types that are not supported by an existing data provider. Sample: Custom virtual table provider with CRUD operations contains some the sample code for the plugins that you need to implement as well how to register these in Datavers but I found the walkthrough - Custom Virtual Table provider with CRUD operations: Introduction and scenario - part 1 of 6 from @capuanodanilo a lot more helpful since it outlines all of the different steps in a more elaborate manner.

Azure Cosmos DB SQL API Data Provider
The Azure Cosmos DB Data Provider has been in preview for quite a while already and you will need to install this from AppSource - Azure Cosmos DB for DocumentDB API Data Provider - based on a recent blog post from @temmy_raharjo  -  [Virtual Entity - Preview] Setup Azure Cosmos DB SQL API Data Provider - the current release seems to be working again (I got stuck with the setup but will add more details when I find time to get it working)

Virtual Connector Data Provider
The Virtual Connector Provider (VCP) for tabular connectors entered public preview in August 2021 (no GA date mentioned). The VCP preview currently supports only SQL Server (both on-premise and on-premise) but the release plan mentions that it will  allow you to use Microsoft Dataverse virtual tables using multiple supported tabular connectors (e.g. SQL Server, OneDrive, Excel, SharePoint, etc...).  Similar to the Cosmos DB Data Provider you will first need to install the solution from AppSource.


I got everything working using the walkthrough  mentioned in Create virtual tables using the virtual connector provider (preview) but overall the configuration experience is still confusing because you have to switch between the new and old solution designer experience (I think it even is safest to just do everything using the old solution designer). 

I also noticed that when you use Azure SQL with the Virtual Connector Provider you might need to add the IP addresses from the Dataverse back-end servers to the Azure SQL whitelist - maybe because my Azure SQL is in a different tenant/subscription then the Dataverse environment. 

After completing the configuration, the virtual tables initially did not work and when looking at the plugin trace logs - I noticed below exception. When adding both IP addresses (probably 2 back-end servers) to Azure SQL - everything started working.


Even though the article Create virtual tables using the virtual connector provider (preview) mentions that you can make the configuration solution aware - I think you first need to test everything especially if you want to automate solution deployment and have specific naming conventions around entities/tables.

The fact that you need to create a connection with all users in your organization is also something that Microsoft will change - a concern which is also shared in this blog post. Dataverse virtual connector provider for SQL Server. Awesome? which also provides some interesting workarounds. I however think that is should be best that in a standard config - only the service principal that you used in the initial configuration should be given access to the SQL without  a need to explicitly share the connection with everyone in the organization.


Summary
Virtual tables indeed show great promise but the Virtual Connector Provider is still a little bit to rough on the edges to use with confidence. As we near GA, I hope additional improvements will be made available especially around the security aspect. 

References: