The other day my Jupyter notebooks did not start correctly from Anaconda navigator - luckily the Jupyter docs have a section Jupyter - What to do when things go wrong. So I tried starting it from Anaconda prompt and it indeed gave me an exception that there was an invalid path in the Jupyter config file - to find out where to look for the config file check out Jupyter common directories and file locations
Thursday, September 22, 2022


Tuesday, September 20, 2022
Quick tip: updating Anaconda with command prompt
I recently started getting a popup for updating Anaconda Navigator on my Windows machine and I also received a warning when installing packages using the Anaconda prompt. I first started the update through the user interface but this update completely stalled and I had to do a hard reboot after almost 2 hours (when my patience ran out). Running the update using Anaconda prompt worked without problems - next time I will use this method first. If conda is installed on your machine, you can update it to the most recent version and patches using conda update -n base -c defaults conda

Sunday, September 18, 2022
Speaking engagements in coming months
With all Covid bans lifted and summer holidays well over, the conference season kicks off.

I will be speaking at a couple of events in the coming weeks and months:
- Dataminds evening session Upcoming in-person event on September 29th organized by dataMinds.be at Inetum-Realdolmen offices in Kontich together with Benni De Jagere. First session a little bit off the beaten track for data professionals: #dataviz for investors. Second session: #PowerBI roadmap and #AMA by Benni.
- Collabdays Belgium 2022. Free community-driven event in Brussels, Belgium. Focus is Microsoft 365 with some Power Platform and Azure sprinkled on top. I am particularly excited to be speaking at this conference which was born out of the SharePoint Saturday conferences which I helped organize many years ago. I will be delivering Dataverse Deep Dive: watch out for sharks.
- Cloudbrew 2022. A two-day conference focusing on all things Azure on November 18-19 in Mechelen Belgium. I will be delivering Using Python and Azure Cloud for trading and investing
Thursday, September 01, 2022
Dataminds event - How data visualization can help you become a better long-term investor and Power BI roadmap session
I will be delivering a Dataminds session together with Benni De Jagere (@BenniDeJagere) on September 29th - for registration and info see the Dataminds in-person event at Realdolmen.

Below the summary of the session and a sneak peak at the opening slide (spoiler alert: investing like a sloth isn't that hard)
How data visualization can help you become a better long term investor
Summary: Whether you prefer passive investing or are more into actively managing your investments, data visualization can help you overcome the emotional biases associated with investing in the financial markets. In this session, we will explore how you can use Python, Azure and Power BI to become a better long term investor. We will start with gathering the relevant data using Python, process it with Synapse and Python, and finally finish off with building data visualizations using Jupyter notebooks and Power BI. We will see how these visualizations can help you understand portfolio returns and risk, get a better understanding of market manias and crashes and visualize different investment strategies.
The aim of this session is not to tell you what stocks, bonds, funds or ETFs to buy but will show you how data visualization might help you not to fall for the irrational and manic-depressive characteristics of Mr. Market or other pitfalls when starting to invest.
Attendees are invited to fill in this survey (max. 5 minutes) https://ecv.microsoft.com/pteCfVQ89I – survey results will be used in the session.
Friday, August 26, 2022
Detailed Power Platform request usage information in Power Platform Admin Center in preview
I wrote a post in January 2022 on the changes in Dynamics 365 and Power Platform request limits and allocations mentioning that detailed reporting was not available at that point in time.
In the meanwhile Microsoft has released Detailed Power Platform request usage information in the Power Platform admin center (Preview). For integration application users you need to look at the Non-licensed User report which shows request usage per day for non-licensed users and the total entitlement for the tenant. Unfortunately for environments with a lot of integrations you might need to revert to some Excel skills or Power BI to make sense of the data (currently working in a tenant where we have 100K+ lines in the CSV export file).

For the moment there is no high usage enforcement for Power Platform request limits, but this might start at least six months after the reports have been made available.

References:
Thursday, August 18, 2022
Presentation on using Python and Azure Cloud for (stock) trading and investing
The presentation from Dataminds Connect 2021 - Using Python and Azure Cloud for (stock) trading and investing is now available on Github - the Jupyter notebooks I demoed during the presentation are also available on Github:

Wednesday, August 17, 2022
Dynamics 365 and Power Platform monthly reading list July 2022

Power Platform and Dynamics 365 release 2022 wave 2
- 2022 release wave 2 plans for Dynamics 365 and Power Platform now available - early access from August 1st, 2022 for other milestones see key dates for the 2022 release wave 2
- UX changes in the update for model driven apps in release 2022 wave 2 by @jukkan
- Modern advanced find test drive
- Supercharge your CRM with Microsoft Viva Sales - now in preview
- 10 highlights of 2022 Release Wave 2 by @CarinaMClaesson
- Introducing the Microsoft Digital Contact Center Platform: a comprehensive, flexible customer care solution
- Enable managed environments (Preview)
- Dynamics 365 Wave 2 2022 Release: Top 10 features in 10 minutes by @LisaCrosbie
Technical topics (Configuration, customization and extensibility)
- Faster Web API metadata access by @markmpn
- Azure Container Apps overview
- XrmToolCast - E081 ALM Accelerator update with Michael Ochs (YouTube)
- How to use associate entities and disassociate entities event in Audit to check security role changes in Dynamics 365 by nishant
- Dataverse: Comparing Create vs ExecuteMultipleRequest vs Azure Service Bus ServiceBugTrigger by @temmy_raharjo
- How can you tell when a PowerApps feature has gone GA
- Application Lifecycle management for the Power Platform using Azure DevOps (using the ALM Accelerator for Power Platform Preview) - see ALM Accelerator for Power Platform Walkthrough videos (Preview) if you are new to ALM Accelerator
- A few requests for Environment Variables by @rappen
- Improve monitoring of Dataverse plugins using Application Insights
- A new experience for subject management available in Dynamics CRM
- Power Platform redefines low-code with new products and features at Microsoft Build and curated list of Power Platform sessions at Build
- Announcing the general availability of Power Apps modern commanding
- Power Automate Flows in solutions are now also visible under My Flows section
- Power Platform & Dynamics 365: Technical update briefing June 23
- The new look of Dataverse tables in Maker portal by @inogic
- Announcing general availability of our new Dataverse experience on Power Apps
- Transition apps to Dataverse ServiceClient (.Net Core) and Dataverse Service Client is now GA
- Power Platform - the controversy on Dataverse
- How to set model-driven app custom table icons in Dataverse by @linnzawwin
- How to create an application user in Dynamics 365 CE Online?
- Create custom notifications - reinvent alerts & notifications with Dynamics 365 CRM by @inogic
Topics for Dynamics 365 Business Applications Platform consultants, project managers and power users
- Deliver authentic customer service with Dynamics 365
- Understanding Power Platform's evolution
- Share and update Dynamics 365 CRM records with Microsoft Teams
- Enhanced auditing retention policy and delete log options in Dynamics 365 CRM
- Editing capability for customer service historical analytics within Dynamics 365 CE
- Enhanced email template editor (preview)
- Knowledge Analytics report in Dynamics 365 Customer Service
- Dynamics 365 - Conversation intelligence
Friday, August 12, 2022
Using the yFinance Python package to download financial data from Yahoo Finance - part 2
In a previous post I showed how you can download ticker data from Yahoo Finance using the yFinance Python package. I now updated the Jupyter notebook code sample using YFinance to also show how you can retrieve additional information (sector, industry, trailing and forward earnings per share, etc...). The Ticker class in the yFinance library contains the info property which returns a dictionary object ( a collection of key-value pairs where each key is associated with a value) which allows you to access specific information about an asset.
Since I wanted to know how fast data retrieval would be I also include the %%time magic command . Wall clock time measures how much time has passed. CPU time is how many (milli)seconds the CPU was busy.

Yahoo Finance contains data about stocks, Exchange Traded Funds (ETF), mutual funds and stock market indices - the information that you can retrieve for each of these differs, so it is safe to check in your code for the quoteType. Below example retrieves information about Apple stock, the iShares MSCI AWCI UCITS ETF (Acc) and a thematic mutual fund from KBC.

I also included a code snippet which shows how to retrieve this information for multiple assets and convert this into a Pandas dataframe.

Tuesday, August 02, 2022
Explore and analyze stock ticker data in Azure data lake with Azure Synapse serverless SQL Pool
In this walkthrough, I will show how you can perform exploratory data analysis on stock market data using Azure Synapse serverless SQL pools. To simplify things I will just focus on daily quotes for the S&P 500.
The S&P 500 (short for Standard & Poor's 500) tracks the performance of 500 large companies listed on exchanges in the United States. The composition of the S&P 500 is typically rebalanced four times per year. The S&P 500 is a capitalization-weighted index meaning that the stocks with a higher market capitalization have a big impact on the changes in the index (See Top 10 S&P 500 stocks by index weight)

I downloaded all daily data for the S&P 500 stock market index (ticker symbol is ^GSPC) from Yahoo Finance using the historical data tab in CSV format. The S&P CSV file contains the date, open, high, low, close, volume, dividends and stock splits for the S&P 500 from December 1927 (but the index in its current form was only created in 1957) until now (dividends and stock splits are not relevant). I manually downloaded the file but take a look at Using Python and Pandas Datareader to retrieve financial data part 3: Yahoo Finance and Using the yFinance Python package to download financial data from Yahoo Finance for ways to automate retrieving data from Yahoo Finance using Python.
Serverless SQL Pools in Azure Synapse
Serverless SQL Pool is an auto-scale SQL query engine that is built-in to Azure Synapse - as the term serverless indicates you don't need to worry about provisioning underlying hardware or software resources. Serverless SQL Pool uses a pay-per-use model so you will only be charged for a query if you run it to process data. Like Synapse dedicated SQL pool, serverless SQL pool also distributes processing across multiple nodes using a scale-out architecture (Check out the Microsoft research publication Polaris: the distributed SQL engine in Azure Synapse for an in-depth discussion).
Synapse Serverless SQL enables you to query external data stored in Azure Storage (including Data Lake Gen 1 and Data Lake Gen2), Cosmos DB and Dataverse. The data remains stored in Azure storage in a supported file format (CSV, JSON, Parquet or delta) and is query processing is handled by the Synapse SQL engine.
Walkthrough: analyzing S&P 500 data with Synapse serverless SQL
In this post I will not show you how you need to setup Azure Synapse - take a look at Quickstart: Create a Synapse Workspace for a detailed walkthrough - the Microsoft Learn learning paths which I added in the references are also quite useful.
In this post, I will be primarily using SQL to analyze the data but this is a matter of preference (having a coding background I prefer Python to do exploratory data analysis)
After you downloaded the data you will need to upload the CSV file to the Azure data lake storage associated with Synapse Link (you can also use a different Azure storage).

The OpenRowset (Bulk..) function allows you to access files in Azure storage. The SP500.csv file has a header row specifying the different columns in use - it contains all daily ticker data since December 1927. I am using Parser_Version 2.0 since it is more performant but it has some limitations (see the Arguments section in Microsoft's OpenRowSet documentation) - also check out How do Synapse serverless SQL pools deal with different file schemas (or schema evolution) part 1 CSV for some interesting info on how schema changes are handled.

If you will be using the data quite frequently, it might make more sense to use a CETAS process (CREATE EXTERNAL TABLE AS SELECT) to generate a dataset pointing to the data residing in the data lake ready for querying. In the Synapse Studio data hub, you can simply right click on a file and select the option to create an external table.

Next, select the database and the name of the table. You will need to create the external table by selecting "Use SQL Script" since you will need to adapt the script to skip the header row for reading data. For CSV files you have the option to infer column names.

You will need to modify the generated script for creating the external file format so that it skips the header row. You are still able to modify the database in which you want to create the external table (1) and I added a line to indicate that the external file contains a header row so data read should start on row 2 (2). Once you understand the script, it also possible to modify it to use wildcards, so that you can read from multiple files in multiple folders.

- Let's get all closing prices for this century ([date]> '2020-01-01') - you will notice that you can also visualize the data using some basic graphs.

- Which were the years with the largest percentage difference between the highest and lowest close for the S&P 500? No surprises here - we have the Wall Street crash of 1929 followed by the Great Depression of the 1930s, the Financial Crisis of 2007-2008 and the Covid crash in 2020 in the top 10

- Which were the days with the highest difference between the day's closing price and the previous closing price - so the days in which the market crashed. In this example I used the SQL Lag() function. Besides the 1930s we also see Black Monday with a 20% decline in the S&P 500 - this triggered a global sell-off (Take a look at this video about Black Monday documentary (YouTube) with traders actually still working on the market floor)

- You can also use common table expressions (CTE) for working with temporary named result sets for more complex queries and data manipulations. In the example below I want to find the 3-day trend for the S&P 500. (See Introduction to the SQL With clause if you are new to CTEs). The idea behind this query is to create a three-day trend variable for any given row. If the closing price on a day is greater than the closing price on the previous day, then we assign that day +1 one, otherwise, that date gets assigned -1 (minx_close columns). If the majority in the previous 3 days consists of positive values, the trend is positive, otherwise the trend is negative. (Example taken from Coursera: Introduction to Trading, Machine Learning & GCP )
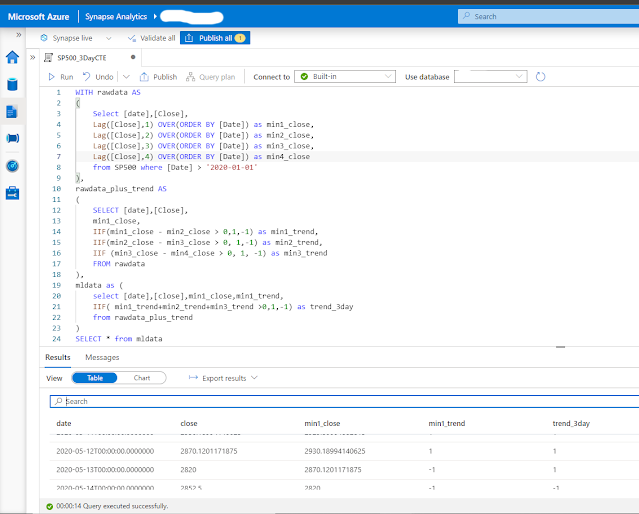


As seen in this post, Synapse serverless SQL is quite useful for data professionals in different situations. Data engineers can use it to explore data from data lake to optimize data transformations, data scientists and data analysts can use it to quickly carry out exploratory data analysis (EDA). Take a look at Build data analytics solutions using Azure Synapse serverless SQL pools (Microsoft Learn) if you want to learn more. In an upcoming post I will show how easy it is to consume the data from Azure Synapse SQL Serverless in Power BI.
References:
- Build data analytics solutions using Azure Synapse serverless SQL pools (Microsoft Learn)
- Microsoft Learn for Data Engineers
- Microsoft Certified: Azure Data Engineer
- How do Synapse serverless SQL pools deal with different file schemas (or schema evolution) part 1 CSV
- DP-203 Data Engineer Lab 02 - Run interactive queries using serverless SQL pools
- SQL Lag function overview and examples
- Black Monday documentary (YouTube) or the news report from Dutch television Zwarte Maandag (Dutch only)
- What is the WITH Clause in SQL
- CTE in SQL and What is a Common Table Expresssion (CTE) and how do you use them ? (YouTube) from @GuyInACube
- Azure Synapse Toolbox
Friday, July 29, 2022
Thoughts about the Dynamics 365 solution architect role
I having been working as a solution architect for over 15 years now and the last 7 years as a Dynamics 365 solution architect (from when we still referred to it as simply Dynamics CRM) and I really like it. But if I tell people that I work as a Dynamics 365 solution architect (even people work in IT), I immediately get the idea that they don't have a clue about what the role entails or what I do (and don't get me started about recruiters).

In this post I will try to shed some light on why it is so hard to clearly define the role and responsibilities of a Dynamics 365 solution architect. I will also explain on what Microsoft thinks about the Dynamics 365 role and why what Microsoft prescribes is not necessarily what applies to the project that you will be working on as a solution architect. I will also list a number of lessons learned and learning resources that I used in the last couple of years.
Context matters
How we approach architecture, defines what architecture, in effect, is, at least for our system. That is, no matter what we say architecture is (for), architecture is (an outcome of) what we do. (Source: What is Software Architecture and related concerns)
The last couple of years, I mainly worked as a solution architect in a large team at Toyota Motor Europe (TME), so I adopted the way of working of TME and the standards and boundaries set for solution architects within Toyota (I will be writing a separate blog post on lessons learned from the Toyota way)
So depending on the customer your work for, the size of the Dynamics 365 project and the associated complexity, the number of consultants working on the project and the overall maturity of the project team as well as the project methodology (agile vs waterfall) the tasks you take on as a Dynamics 365 solution architect and your role and responsibilities might differ quite a lot.
Whether you are full-time working for a single project (embedded architect) or supporting multiple teams (wandering/travelling architect) also makes a big difference.
Architecture is about significant design decisions

I think that if you look at the role of the Dynamics 365 solution architecture from a very minimalistic viewpoint, there are three key activities and deliverables:
- The high level architecture visualization - remember a picture says more than a thousand words - definitely take a look at good models like C4 from Simon Brown
- Maintaining a list of architecture design decisions together with the project team (take a look at Architectural Decision Records | adr.github.io for some more info)
- Coaching and mentoring the team to create an architecture awareness (understand design trade-offs, keep track of non-functional requirements, identify architecture risks and counter measures, understanding and handling technical debt)
A solution architect has to keep the long-term use of his solution in mind and implement scalability and adaptability into the solution for the future.
Success By Design and FastTrack
I learned a lot from the joint-design workshops and conversations with the Microsoft FastTrack solution architect assigned on some of my projects. For those of you unfamiliar with FastTrack for Dynamics 365, this is a Microsoft implementation support program for large Dynamics 365 implementations - this includes Customer Engagement (Sales, Customer Services, Field Services, Project Operations and Marketing) as well as Dynamics 365 Finance, Commerce, Supply Chain Management and Human Resources.
The full FastTrack program is only available for a selected group of customers (threshold based on Dynamics 365 annual licensing revenue or internal approval by Microsoft account team) and Microsoft partners (only partners with gold or silver status in Cloud Business Applications competency). When you participate in the FastTrack program, you will be assigned a Microsoft FastTrack solution architect which you can use as a sounding board for design choices, receive guidance on best practices and how to plan for a successful roll-out.
 Also take a look at Dynamics 365 Fasttrack Architecture Insights - recordings created and shared by solution architects from the Dynamics 365 engineering team.
Microsoft about the Dynamics 365 solution architect
Two years ago I took a Microsoft certification exam targeted at solution architects in the Dynamics 365 space. I really enjoyed taking the exam MB-600: Microsoft Dynamics 365/Power Platform Solution Architect (now replaced by PL-600: Microsoft Power Platform Solution Architect) since it gives great insights on how Microsoft looks at the role of a Dynamics 365 solution architect.
As a preparation for this exam, I followed the Architect solutions for Dynamics 365 and Microsoft Power Platform (screenshot below taken from this learning path) and together with the Microsoft FastTrack boot camp for Dynamics 365 CE solution architects, this shaped a lot of my thinking about the role of a Dynamics 365 solution architect.

A key task of the solution architect is solution envisioning. Traditionally, a development-focused architect would start with custom development and low-level Azure services. A business applications focused solution architect will instead start with Dynamics 365 and Power Platform and then use third party components, custom development and Microsoft Azure to address any gaps.
In-depth knowledge of the products in the Microsoft BizApps stacks is therefore a must have and hands-on experience with one or more products helps you in becoming a better architect. If you look at the videos from Gus Gonzalez on How do you become a solution architect and 3 rules for solution architects and consultants or listen to some of the episodes of the CRM MVP Podcast you will also get a feel about what other solution architects think about their role.
Microsoft seems to assume that a solution architect needs to be embedded into the team and does not make any mention of the notion of the travelling architect. The idea behind a travelling architect is that he/she will support multiple projects and provide support for teams who lack architectural skills by either coaching them, tackling specific architecture issues by him/herself, etc ... If you are working for a partner organization who is doing multiple smaller projects in parallel the role of a travelling architect makes more sense.
Working with other architects
Depending on their scope of work, different types of architects work at different levels of abstraction - until now I have worked with enterprise architects, business architects and technical architects. In my current project, I work very closely with EA to make sure that the solution blueprint aligns with the set of architecture principles and principles defined by EA.

A solution architect is not the same as an enterprise architect (although you might combine both roles) - an enterprise architect has a more strategic role and handles the initiatives that are required within a digital transformation at enterprise level to ensure that the business achieves their goals (business intent). It is however useful that you have a good understanding about enterprise architecture as a function and affinity with EA frameworks.
Get involved during the initial definition of a project/program
When I took a TOGAF training course years ago, I still remember an architect being called a "best effort architect" when he is not involved in the early stages of a program or project. If you are working on customer side and you are not involved during the initial business case creation, project or program initial scope definition, you are a "best effort architect" meaning that you miss a lot of the context and a large numbers of important decisions have already been made so you can only give it your best effort.
Same goes for architects working at a consultancy or implementation partner, if you are not involved during the initial presales phase, you are constrained due to (implicit) design decisions which were already made during presales phase while answering the RFP or presenting demo cases.
Learn by doing
So if you are a Dynamics 365 solution consultant or technical consultant and you want to take the leap, there are a lot of resources to ease into the role but nothing beats learning by doing. Also keep in mind that as a solution architect lifelong learning is a prerequisite for success (but probably also for other roles)

If you are lucky, you might encounter someone within the company you work for who can coach you to grow into the role but also reach out to the broader Dynamics 365 community for questions or feedback.
- 3 rules for solution architects and consultants by @gusgonzalez
- Dynamics 365 Fasttrack Architecture Insights - recordings created and shared by solution architects from the Dynamics 365 engineering team
- Fasttrack - Dynamics 365 Implementation Guide (pdf) - not being updated anymore - Microsoft only updates the web version at https://aka.ms/D365ImplementationGuide
- Common types of Software Architects
- Software architecture for a Post AI and Post Quantum World (Grady Booch - YouTube)
- Handbook of software architecture (Grady Booch)
- The solution blueprint review as cornerstone of FastTrack Success by Design
- How architecture diagrams enable better conversations by @kzhen
- An architect is not an evangelist
Monday, July 25, 2022
Quick tip: finding the Azure data center for your Dynamics 365/CRM online environment
Dynamics 365 (CRM) is being hosted in a number of different Azure datacenters - on Administer Power Platform - Data center regions you will see an overview of the different regions. If your region is EUR (so url is crm4.dynamics.com), then the linked Azure datacenters can be in Amsterdam (West Europe) or Dublin (North Europe). There is a interesting visualization available on Azure Global Infrastructure

If you need to know whether a CRM instance is hosted in Amsterdam or Dublin (for example when you are setting up Azure Synapse Link for Dataverse), you can simply ping the url of your CRM instance (it will time-out but that is no problem) - if the response url starts with ams it is hosted in Amsterdam, if it is hosted in Dublin, the response will start with dub.

If you want to change the primary datacenter from North Europe (Dublin) to West Europe (Amsterdam) or vice versa, you can open a Microsoft support ticket. This seems to be a quite common operation and the support request is usually treated quite quickly.
Friday, July 22, 2022
Quick tip: download links for icons of Azure, Power Platform and Dynamics 365 products
If you are looking for the official collection of icons for Power Platform, Azure or Dynamics 365 that you can use in architectural diagrams or diagrams - here they are:
Thursday, July 21, 2022
Using the yFinance Python package to download financial data from Yahoo Finance
In a previous post I explained how you can retrieve data from Yahoo Finance using Python and Pandas Datareader - an alternative Python library for retrieving data from Yahoo Finance is yFinance maintained by Ran Aroussi.
If you are using conda package manager, you will notice that you can not install yfinance using conda so you will need to revert to pip install yfinance. All documentation is available on yFinance as well as on https://github.com/ranaroussi/yfinance but I also uploaded a Jupyter notebook code sample on my Github - https://github.com/jorisp/tradingnotebooks/blob/master/yfinance_sample.ipynb

Wednesday, June 22, 2022
ActivityParty not supported in Azure Data Factory copy activity for Dynamics 365
I must admit that I am not a frequent user of Azure Data Factory but now and then I give it a try again ( see Getting started with Azure Data Factory for Dynamics 365 CRM consultants for my previous post on the topic) when I need to import data into Dataverse/Dynamics 365 CE or export data from Dataverse/Dynamics 365. Usually I do this when I hit a snag with the out-of-the box tooling or when I need to connect to a legacy on-premise Dynamics CRM environment.
Last week I tried doing a bulk export of incoming e-mails in Dynamics 365 CE to Azure Blob Storage using the copy activity. I quickly created setup a sink and source, created by my FetchXML query and then run the data pipeline. It immediately blew up with an exception message "ErrorCode=DataTypeNotSupported,'Type=Microsoft.DataTransfer.Common.Shared.HybridDeliveryException,Message=Column: from,The data type Microsoft.Xrm.Sdk.EntityCollection is not supported.,Source=,'

When looking at the mapping, I found the exception so I thought let's take a look at the blog posts of @Joejgriffin - Sink limitations with the Dynamics 365 Customer Engagement/CDS connector for Azure Data Factory seemed to be provide some good pointers but unfortunately did not get my any further so I just decided to write a console app ...

Monday, June 20, 2022
Analyze model-driven apps and Microsoft Dataverse telemetry with Application Insights
Beginning of May 2022, Microsoft announced that the ability to configure an Azure Application Insights resource to receive telemetry on diagnostics and performance of Dynamics 365/Dataverse model driven apps was generally available.
Integration of Dynamics 365/Dataverse with Application Insights enables new monitoring strategies for Dynamics 365/Dataverse. Application Insights will allow you to detect and resolve issues before the end user notices it. I also think this is very useful for following up on performance impact during big data loads/migrations (see screenshot below where Dataverse processed 6.1 million requests). Application Insights integration is a nice addition to the already extensive toolkit as outlined in the Monitoring the Power Platform blog series by @pfedynamics

The logs in Application Insights allow you to build queries to troubleshoot and monitor your solutions and answer questions like:
- Why are some of my users experiencing slowness on Unified Interface?
- How can I determine whether my plug-in upgrade caused a performance degradation?
- Can I drill down on errors or failures at specific times for specific users to allow for understanding the call stack?
- Why are users experiencing issues with a specific form?
If you want to learn more and see some examples - definitely take a look at the blog post from @decastroallan on Analyzing your Dataverse environment using Application Insights
The performance insights (preview) for model-driven apps is probably leveraging the same telemetry but since you now have access to the raw data in the underlying logs it will be easier to pin point potential issues or discover ways to improve the performance and/or user experience.
KQL (Kusto Query Language) can be used to query the logs in Application Insights in a scalable fashion - KQL can be used to also query other Azure components like Azure Log Analytics, Microsoft Defender and Azure Data Explorer. KQL is a SQL-like query language which is powered by the Kusto Engine that allows you to query, filter, sort and aggregate data. It was built specifically built for the cloud and scales quite well. Unlike SQL, KQL can not create, update or delete data - it is purely meant to be used for query operations.
References:
- Analyzing your Dataverse environment using Application Insights by @decastroallan
- What are performance insights (preview)
- Tutorial: Use Kusto queries
- Querying telemetries from multiple Application Insights instances
- What is Azure Data Explorer and Kusto Query Language
- Learning the Kusto Query Language (KQL) with Application Insight Logs
- Introducing Performance Insights (preview) for model-driven apps
- Microsoft Learn - write your first query with Kusto Query Language
Sunday, June 12, 2022
Using Python and Pandas Datareader to retrieve financial data - part 3: Yahoo Finance
Yahoo Finance is one of the most popular sources of free financial data. It does not only contain historical data but also financial statements, dividend information and calculated metrics like e.g. 50 and 200 day moving average, beta, etc ... Yahoo Finance does not have an officially supported API anymore but pandas-datareader still allows you to access the data from Yahoo Finance in Python (other alternatives are yfinance and yahoo_fin).
This post is part of a series on using Pandas datareader to retrieve financial data:
- Using Python and Pandas Datareader to retrieve financial data - part 1: Federal Reserve Data (FRED)
- Using Python and Pandas Datareader to retrieve financial data - part 2: Fama & French library
- Using Python and Pandas Datareader to retrieve financial data - part 3: Yahoo Finance
In this post I have used version 0.10.0 of pandas-datareader (released July 13, 2021) which is currently working with Yahoo Finance - previous versions of pandas-datareader had to be updated after Yahoo made some changes on the underlying API.
Warning: Accessing Yahoo Finance using Python libraries is quite brittle so don't try to built production trading systems using this data source.

Accessing the Yahoo Finance API using pandas-datareader is very simple as shown in the screenshot below but I would also recommend implementing a cache mechanism for your queries using the requests-cache Python library to avoid having your IP address being banned. The full source of this Jupyter notebook is available at https://github.com/jorisp/tradingnotebooks/blob/master/YahooFinancesingle.ipynb

References:
Thursday, June 09, 2022
Optionset support in the Power BI Dataverse connector
One of the gotchas of using Power BI to build reports for Dynamics 365 CE (or Dataverse) has been how to easily handle optionset columns (or choice columns as they are now called in the new Dataverse terminology). You had to use work arounds to display the optionset labels as explained in Using Power BI Desktop to build Dynamics CRM Online reports part 4 (article dating back to 2015).
As outlined in Create a Power BI report using data from Dataverse - choice columns are now handled out of the box e.g. in the account table you have a choice (optionset) column called "industrycode" - in Power BI you will now see two columns - "industrycode" (the integer value) and "industrycodename" (the friendly display name of the item)

Also consider the warnings outlined on the official Microsoft documentation though - filtering by choice value can have a performance impact and you also need to make sure that all customizations in Dataverse have been published.
Related links:
Wednesday, June 01, 2022
Dynamics 365 and Power Platform monthly reading list May 2022

Technical topics (Configuration, customization and extensibility)
- Use custom connectors with the timeline control (Microsoft docs)
- Power Platform | Crawl, run & build by @Carsten_Groth
- Power CAT code components - a set of Power Apps Component Framework (PCF) controls that can be used to enhance Power Apps
- Configuring Sales Acceleration Reporting (Preview) feature in Dynamics 365 CE
- Setting up Azure Synapse Link for Dynamics 365/Dataverse
- Omnichannel for Customer Service - Outbound Voice Calling
- Azure Data Factory - SQL Server to Dataverse - Power CAT Live
- Notifications in Model Driven Apps - Power CAT Live
- Inside Dataverse Data Storage - Power CAT Live
- Customer Service Historical Analytics Report in Dynamics 365 Customer Service - Part 2
- Announcing new data sources for the Virtual Connection Provider
- What you might not know about FetchXML Builder by @CarinaMClaesson
- Dataverse ServiceClient - expected 1.0 release in June 2022 with support for .NET Core
- Microsoft Dynamics 365 - Success by Design implementation guide - new version released
- Latest innovations to scale automation with Microsoft Power Automate (Build 2022 announcement)
- Meet the developers combining Power Platform and Azure to go faster
- Interact with Dynamics 365 records in Teams Chat (Preview) by @D365Goddess
- EnableFolding option for Dataverse Native SQL Power Queries
- Analyze model-driven apps and Microsoft Dataverse telemetry with Application Insights (General Available)
- In Power BI, filter a Dataverse source to create a "My" records query
- Configuring timeline (show/hide) activity display information in Dynamics 365 CE
- The benefits of using Dynamics 365 Customer Insights
- How to efficiently collaborate using built-in Microsoft Teams Chat in Dynamics 365 Sales
- Custom pages: a step towards disappearing lines between Canvas Apps and model driven apps in Power Platform/Dynamics 365 by @inogic
- Top 5 Power Platform features from Microsoft Build 2022 by @IFainberg
- Implement Power Platform Landing Zones and Enterprise Fusion Deployment Patterns (YouTube)
- Dataverse Advanced Audit Log Deletion using the BulkDelete API
Topics for Dynamics 365 Business Applications Platform consultants, project managers and power users
- Dynamics 365 Sales Premium features available for enterprise customers (D365 Fasttrack Architecture Insights recording)
- Accelerate business outcomes with Microsoft Teams meeting integration for Dynamics 365 Sales
- Get 360 degrees view of your customer using Dynamics 365 Customer Insights
- Let's talk about funnels by @stevemordue
- What's new: the evolution of Power Virtual Agents (Build 2022) and What's new for Microsoft's Conversational AI and Power Virtual Agents (Build 2022)
- Resolve complex cases faster using customer support swarming in Dynamics 365 Customer Service (YouTube)
- Exciting new capabilities for AI Builder (Build 2022)
- How to foster customer loyalty through personalized experiences
- Dynamics 365 Sales release wave 1: simplifying the things that matter
- Announcing the preview of Microsoft Power Pages
Monday, May 23, 2022
The answer to every licensing question is 42
The answer to life, the universe and everything else is 42 (check out The Hitchhiker's Guide to the Galaxy if you want to know where this comes from), so when a customer asks a question about Dynamics 365 and Power Platform licensing, I would also like to just be able to answer 42.

Having worked with Microsoft products for over 20 years now, the single constant seems to be that Microsoft licensing is in a continuous state of flux. This is especially true for cloud platforms so make sure that you involve the necessary experts to help you in making the correct decisions and keep you up to date.
In this blog post I am trying to shed some light on some interesting licensing updates for Microsoft Dynamics 365 and the Power Platform. I will also provide some links to excellent posts/videos from other community members - this is by no means an exhaustive list.
Power Platform and Dynamics 365 request limits and allocations
I recently wrote a blog post about the Update to Power Platform and Dynamics 365 request limits and allocations . Microsoft has finally released a preview of the Power Platform requests reporting in May 2022.

As noted in the official docs - What are the timelines for Power Platform Request limits? - enforcement of these limits will be activated at least 6 months after reports have been made GA. In my opinion, things like requests limits and allocations are quite hard for customers to understand and also difficult to design for.

Pay as you go licensing for Power Platform
In March 2022, pay-as-you-go licensing for Power Platform reached general availability. With apay-as-you-go plan, customers can use an Azure subscription to pay for Power Apps based on active usage of the apps instead of purchasing and allocating licenses in advance. If you compare the unit pricing you will see that for similar workloads - the pay-as-you-go licensing price per unit is higher. So this will make an interesting balancing act for customers.

Scenarios combining Microsoft Teams and Dynamics 365
Don't get me wrong; I am really excited about the integration scenarios between Microsoft Teams and Dynamics 365 but announcements like Bring Dynamics 365 into the flow of work with Teams - at no additional cost generate a lot of excitement with customers but once you try to implement it you will notice that users do need a Dynamics 365 team member license. Be cautious and take big announcements with a grain of salt and always validate them yourself. When a user has a valid Dynamics 365 license, you are now able to view and edit Dynamics 365 records inside Microsoft Teams.
Integration scenarios with Microsoft Teams are a great feature but the obscurity of Microsoft licensing around this, makes the discussion for consultants harder than needed.
References:
- Power Platform licensing revisited
- Power Platform licensing, November 2021 updates
- PowerApps Pay As You Go licensing model - compare and configure (Youtube) from @ShaneYoung
- Is Dynamics 365 data now "free" in Microsoft Teams by @Jukkan
Subscribe to:
Posts (Atom)