Thursday, January 19, 2023

Technical debt and Dynamics 365 solution architecture

Technical debt is an important concept to understand as a solution architect. As outlined in Thoughts about the Dynamics 365 solution architect role, a solution architect has to keep the long-term use of the solution in mind and implement scalability and adaptability into the solution for the future. This is where you will need to understand the concept of technical debt.  Software design and development is full of metaphors to help non-technical people understand specific concepts - technical debt is one of them. 


What is technical debt?

Technical debt is created by (un)conscious actions to take shortcuts in development or design of a software solution. These shortcuts are taken due to some short-term benefits such as faster delivery time, easier implement etc. ... but they have an impact on the longer term. 

Having technical debt is like having financial debt, where time spent on this "not-quite-right implementation" counts as interest on the debt and paying the interest on the loan (the debt) might slow down the project/program in the long term. 

You will see 3 types of technical debt in projects:
  • Strategic technical debt: technical debt caused by decisions made to shorten time to market, delay development or expenses, ...
  • Unavoidable technical debt: technical debt accumulated due to the fact that the platform/technology/product version might not be supported anymore, ...
  • Naïve technical debt: due to business immaturity (unclear or changing requirements, misalignment between product owner and business stakeholders) or technical immaturity (no coding standards, no peer reviews, no automated tests, no refactoring, no consideration for)

It is important to grasp that technical debt is not always an indicator of low quality (but it might be). Technical debt happens because even though we do the best we can - given what we know - we subsequently learn better ways to solve a problem or better ways appear due to technical improvements in the underlying platform or technology stack.  You probably heard the phrase "Ignorance is bliss" - well for technical debt this is not the case. The fact that nobody in a team has heard of technical debt should be treated as a red flag for software quality.

How to repay technical debt?

Regardless of the type of technical debt you accumulated, in the end you will always need to repay the technical debt to make sure that you don’t jeopardize your product evolution. If the cost to implement a certain change (be it a bug fix or adding an additional feature) keeps increasing over time, it might be an indicator that you have incurred technical debt on your project.

The first step is however making business aware of the existence of technical debt and the impact of it. I really like the ideas suggested in The Wall of Technical Debt on how to make technical debt visible. Building a regular habit of identifying technical debt and learning on how to negotiate with business on technical debt payoff is a good approach.

Keeping technical debt to a minimal is a team effort - make sure that delivering quality is engrained in the culture and way of working of the team.

How to identify technical debt in your Dynamics 365 solution architecture?

As mentioned previously technical debt is automatically accumulated as changes are happening on the technical platform underpinning your solution. So I highly recommend to follow up on the  important changes (deprecations) in Power Apps and Power Automate page and also on the Deprecation of Dynamics 365 apps page. 

By writing code, you are automatically accumulating some amount of technical debt but there is tooling available to help you identify technical debt in your code and solutions:

  • SonarQube - static code analysis tool which helps you identify bugs and code smells - works for multiple languages. Quite useful for .NET and Javascript development which are typically used in CRM development
  • Power Apps solution checker - specific Power Platform tooling to analyze Dataverse or Dynamics CRM solutions. Can be run from the maker portal,  Microsoft Power Platform Build tools for Azure DevOps or PowerShell
  • Checkmarx provides static application security testing (SAST and open source composition analysis (SCA). It helps you uncover security issues in your code base or in 3d party libraries/packages that you are using. If you are looking for alternatives, you might take a look at the vulnerability scanning tools listing from OWASP
Technical debt goes broader than purely code. Technical debt is a collection of issues which makes the overall solution hard to maintain, prevent easy implementation of updates, might impact performance and scalability. So lack of technical documentation, absence of a good application lifecycle management (ALM) process, lack of test automation/heavy reliance on manual testing, missing architectural design decision log, brittle integration, monitoring, etc ... are also things to take into account as part of a health assessment of a solution architecture.

References:

Tuesday, January 10, 2023

Interactive chart visualizations using Python and bqplot: visualizing S&P500 returns

A couple of months ago, I stumbled upon this interesting presentation Jupyter Notebooks: interactive visualization approaches. The presentation showed how you can use bqplot to build interactive visualizations. 

Bqplot contains a set of 2D plotting widgets built on top of the ipywidgets framework for Jupyter notebooks. The bqplot package aims to bring d3.js visualizations to Python while retaining the flexibility and ease of use of ipywidgets and was developed by the quantitative research team at Bloomberg. You can install bqplot using conda or pip. 


One of the examples built by the team that you can find on Github is a Jupyter notebook which shows US equity market performance (using the S&P 500 index) where you can select an interval on a time series chart - for the selected area you get the total return as well as a histogram of the daily returns.

References:

Monday, January 09, 2023

Why I blog and you might want to consider it as well

A couple of weeks ago I got the question why I write a blog since it would be better to do a podcast or publish videos on technical content. In this post, I will explain why it is still a good idea to start blogging.  I wrote my first blog post almost 18 years ago  and got inspired by Robert Scoble (Scobleizer) who worked as a technical evangelist at Microsoft at that time and had a very popular blog.  1483 blog posts and almost 2 million views of these blogs I still consider it a good idea, since  I think that a lot of good things have happened to me in my professional live because I decided to start my blog and share my thoughts on technology.  


Starting a blog is an easy starting point for you to be active in the technical community. Sharing is caring might sound lame but it is a good credo to live by as an IT professional/consultant.  In a professional context,  most persons  only know the people that they directly work with - colleagues or customers. 

Blogging (but also Twitter and technical communities) allows you to expand that and suddenly there are people all over the world that you can learn from and they can learn from you. Suddenly you will realize there are others who face similar challenges. By sharing your experiences and offering advice to support, you can build a community of readers who value your experience. By writing good high-quality content on a regular basis, you can establish yourself as an expert in your field which in turn will help you build your personal brand and increase your visibility. Starting a blog is a lot easier than creating a video on YouTube or doing a podcast.

The most underrated skill to have in IT is the ability to communicate efficiently. Blogging is levelling that skill up. In an era where people mostly rely on PowerPoints slides for presenting a plan or a vision, it is quite refreshing to see them back it up with a well-written, solid document afterwards. I usually cringe when seeing poorly written documents or e-mails so I think that good writing skills will set you apart. 

I think of a blog as a way to write notes to myself and you should too. Throughout your daily job, you are continuously solving problems: write about how you approached solving these problems and where you found helpful information. By writing your approach down, you will remember it better and it will be easier for you to find it later (and others will benefit of this as well). 


The more you explain a concept or a topic to other people, the better you will get at understanding it yourself. This might sound strange but it is true, teach to learn. When you need to teach something, you are required to understand it in a deep and comprehensive way. The process of writing, will help your own understanding and requires you to think critically and find creative ways to present the topic which further enhances your understanding and retention of the information.

Even when you are learning something new, you are probably taking notes. Blog these notes, taking these notes. Rewriting them will help you understand the content much better, while it helps others too. If you think that everything is already written, do it for your own reference. If you find it useful yourself to go back to your blog, then it is OK. Don't fuzz to much about getting little visitors to your blog in the beginning.

References:

Thursday, January 05, 2023

Dynamics 365 and Power Platform monthly reading list December 2022

First post of 2023 - so let's close with last month's  suggested reading list. If you want to catch up on previous reading lists for 2022 - here is the list:

 Technical topics (Configuration, customization and extensibility)

Topics for Dynamics 365 Business Applications Platform consultants, project managers and power users

Monday, January 02, 2023

Notes on deploying and troubleshooting a Streamlit app on Azure App Services

 A couple of weeks ago I was playing around with Streamlit and decided to deploy it on Azure a
using Azure App Services using the guidance from Deploying Streamlit Applications with Azure App Services . 

Streamlit is an open-source Python library that allows you to create interactive, data-driven web applications in just a few lines of Python code. It does not require you to have any JavaScript, html or CSS experience.  


The deployment using the steps outlined in the blog post went quite smooth but when I navigated to the website, I was greeted by an exception.

Since I haven't worked with Linux for over 20 years now, I feared to be in for a long and painful experience to get this resolved but it actually turned out to be easier then expected. 

First step, I took was looking at the Application Logs for the Azure Web App. Go to the Azure App Service > Diagnose and solve problems > Application Logs. 

When scrolling through the Application Logs

The exception log "TypeError: Descriptor cannot be created directly. Your  generated code is 
out of data and must be regenerated with protoc > 3.19.0. If you cannot immediately
regenerate your protos, some other possible workarounds are: 1. Downgrade the protobuf package to 3.20.x or lower" actually pointed me to a thread on the Streamlit forums - Issue with Protocol Buffers. After changing requirements.txt  to deploy a newer version of Streamlit (see Configure a Linux Python App for Azure App Service for more details on how the Azure App Service deployment engine automatically runs pip install.) all started working correctly again.

Monday, November 21, 2022

Reminders for the occasional Power BI creator

I am not a regular Power BI user, but every couple of months I will create some Power BI reports (e.g., Storage capacity management for Dynamics 365/Dataverse ) because Power BI is simply great to visualize and analyze data. 


Unfortunately, I tend to forget - maybe very obvious things to frequent Power BI users - how to perform specific tasks in Power BI. 

So here it goes - my list of reminders for the occasional Power BI creator.


References:

Wednesday, November 16, 2022

Visualize S&P 500 data in Power BI using Azure Synapse Serverless SQL Pool

In Explore and analyze stock ticker data in Azure data lake with Azure Synapse serverless SQL Pool, I showed you can download stock ticker data from Yahoo Finance, stored it in Azure Data Lake and retrieve the data using standard T-SQL in Azure Synapse Studio. In this post, I will show how easy it is to consume the data from Synapse SQL Serverless using Power BI.


For the standard visual with the evolution of the S&P 500 closing price, I connected directly on SP500 external table in the Synapse SQL. You can connect to Synapse SQL Serverless using either the Azure SQL Database or Azure Synapse Analytics SQL connector and you will need to enter the Serverless SQL endpoint which looks something like this <yoursynapse>-ondemand.sql.azuresynapse.net


With the second reported I want to visualize the S&P 500 yearly return and the average return since December 1927. To make it easier, I created a separate view on top of the external table which calculates the yearly returns


As you see from the visual, returns can vary quite a lot both on the negative side as well as on the positive side - for the last 20 years, there was a huge drop in 2008 (-38%) and also this year is not looking great (-22%), but 2013, 2019 and 2021 all had returns above 20%. On average across the S&P 500 returned 7% (not included dividends).


For the last visual in the Power BI report, I wanted to show a histogram with the S&P 500 yearly returns. I based myself on Power BI Histogram example using DAX since  Power BI does not have a standard histogram and I did not want to use a custom visual ( I used Power BI custom visuals from Pragmatic Works in the past)

Equity returns roughly follow a normal distribution or "bell curve", meaning that most values cluster near the central peak and values farther from the average are less common.  Stock returns however have fat tails - meaning that the occurrences on the extremes are far more common than expected in a normal distribution.  The Greate Depression (1931) and the Global Financial Crisis (2008) led to two of the largest stock market losses of the S&P 500. With a loss between -20% and -30% this year, we are in the same category/bin as 1930, 1974 and 2002.


Monday, November 14, 2022

Azure functions with Python: a getting started guide

In this post, we'll learn what Azure Functions are, and how you can use VS Code to write your first Azure Function in Python code. 

I will show how you can create a simple Azure Function which retrieves data from Yahoo Finance (See Using Python and Pandas Datareader to retrieve financial data - part 3: Yahoo Finance) and saves the retrieved data in a CSV file in Azure blob storage. I will be using the Python v1 programming model for Azure Functions since v2 is still in preview.

Introduction to Serverless and Azure Functions

More traditional forms of cloud usage require you to provision virtual machines in the cloud, deploy your code to these VMs, manage resource usage and scaling, keep the OS up to date and the underlying stack, setup monitoring, perform backups, etc... 

But if you just want to deploy some piece of code which needs to handle some kind of event, serverless compute might be the right choice for you. With serverless compute, you can develop your applications, deploy it to the serverless service like Azure Functions and you don't need to worry about the underlying hosting architecture. Serverless compute is most of the time cheaper than PAAS or IAAS hosting models. 


Several versions of the Azure Functions runtime are available - see Languages by runtime version for an overview which languages are supported in each runtime version. Python 3.7, 3.8 and 3.9 are supported by Azure Functions v2, v3 and v4. 

How to create an Azure Function using Azure Portal

You can deploy an Azure Function from your local machine to Azure without leaving VS Code, but I would recommend doing it first using the Azure Portal to understand what VS Code is doing behind the scenes. 

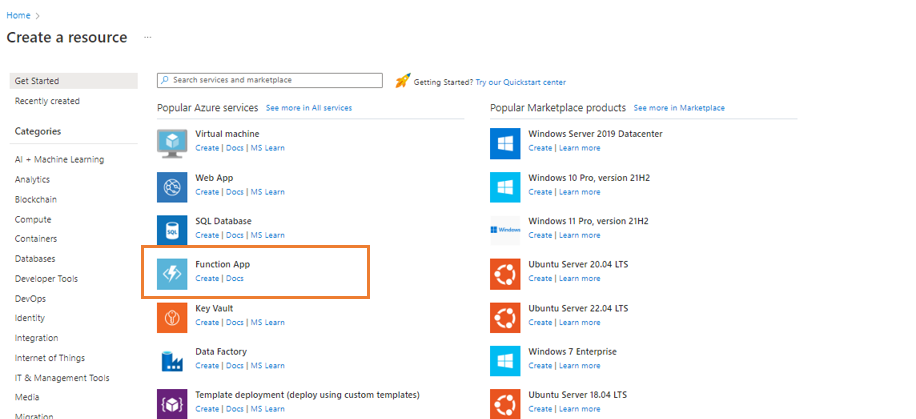
To create your Azure Function, click the Create a resource link on the Azure Portal home page and next select Function App.


This brings us to the function creation screen, where we have to provide some configuration details before our function is created:

  • Subscription: Azure subscription in which you want to deploy your Azure Function App
  • Resource group: container that holds related resources for an Azure solution - these resources typically share the same development lifecycle, permissions and policies, ...
  • Function App Name
  • Runtime stack: Python
  • Version: choose 3.9 (latest supported version) unless you have specific Python version dependencies.
  • Region: choose the same region as other resource that you need to deploy e.g., blob storage, Cosmos DB, etc. ...
  • Operating system: only Linux is supported
  • Plan type: leave it to Consumption (Serverless) unless you have very specific requirements with regards to execution time limit higher than 10 minutes (see Azure functions scale and hosting - function app timeout duration for more details)
In the next configuration screens just leave the default options but do make sure that you link up an Application Insights resource to your Azure function.

Setup your development environment

Things to setup beforehand:

Create your local Azure Function project in VS Code

Let's now see how you can create a local Azure Functions project in Python - open the Command Palette and choose Azure Functions: Create function. Next select Python, the Python interpreter to create a virtual environment, the template for the function (HTTP trigger) and the authorization level. Based on the provided information, Visual Studio Code will generate the different files in your project.

When you choose "HTTP trigger", it means that the function will activate when the function app receives a HTTP call. The name that you specified for the Function name (jopxtickerdata) will be used to create a new directory which contains three files:
  • function.json - configuration file for our function
  • sample.dat - sample data to test the function
  • __init__.py  - main file with the code that our function runs
You can also add in your own Python code files (e.g. jopxlib.py) that you can use afterwards __init__.py , see Azure Functions Python developer guide - Import behavior for more details.
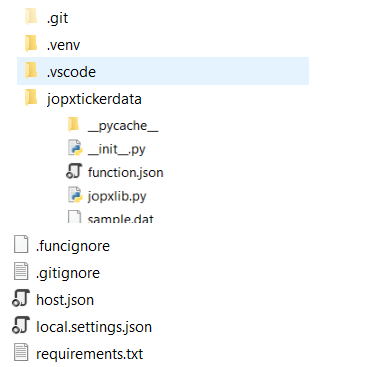
In the root directory of your project you will also see other files and folders:
  • local.settings.json: stores app settings and connection strings when running locally
  • requirements.txt: list of Python packages the system installs when publishing to Azure
  • host.json: configuration options that affect all functions in a function app instance
  • .venv:   folder which contains the Python virtual environment used by local development.
I slightly modified the standard generated HTTP trigger so that it accepts 2 query string parameters (name and startdate), added a reference to my own Python code (jopxlib) and called the writetickertoazblob function within the main function.


The code of  writetickertoazblob is quite simple - it will download data from Yahoo Finance in a dataframe and then save the dataframe to CSV and upload it to Azure Blob Storage. in Azure functons, application settings are exposed as environment variables during execution os.environ["AZURE_STORAGE_CONNECTION_STRING"] will read the application setting with name AZURE_STORAGE_CONNECTION_STRING


Wednesday, October 26, 2022

Creating a Dataverse instance in a specific Azure region using Power Apps Admin PowerShell module

One of the prerequisites if you need to setup Azure Synapse Link for Dataverse is that the Dataverse/Dynamics 365 environment must be created in the same Azure region as the Azure Data Lake storage account. 

So, if you know that you will be using Azure Synapse Link for Dataverse functionality and you want to avoid opening a support ticket for moving your environment (see Quick tip: finding the Azure data center for your Dynamics 365/Online environment for more details), you will need to create the Dataverse instance in the correct region. 

Unfortunately, this is not possible using the standard user interface but luckily you can use the Power Apps admin PowerShell module (Microsoft.PowerApps.Administration.PowerShell)


I am not sure in which version the functionality was added to enable creation of a Dataverse environment in a specific Azure region was added so if you already installed this PowerShell previously I would recommend updating to the latest version using the update-module command.


When using the New-AdminPowerAppEnvironment command you can specify the location and region you need (for example -LocationName "europe" -RegionName "westeurope"). For a list of supported environment locations and regions you can run Get-AdminPowerAppEnvironmentLocations


References:


Monday, October 24, 2022

CollabDays Belgium 2022 - a look back


CollabDays Belgium 2022 was simply amazing. It was really great to get together with some old friends and meet new people in the #Microsoft365 community. Unfortunately, there were so many excellent sessions that I could not attend them all, but I learned a lot in different sessions. The slidedeck of my session Dataverse deep dive: watch out for the sharks is now available for download on GitHub

If you are a Microsoft365 professional working in Belgium, I highly recommend you register as a BIWUG member - it is amazing to see how this user group and community has managed to still stay vibrant and relevant more 17 years after the first BIWUG meeting in September 2005.

Tuesday, October 04, 2022

Dynamics 365 and Power Platform monthly reading list September 2022

Power Platform and Dynamics 365 release 2022 wave 2

Technical topics (Configuration, customization and extensibility)

Topics for Dynamics 365 Business Applications Platform consultants, project managers and power users

Thursday, September 22, 2022

Quick tip: troubleshooting Jupyter notebook not starting correctly

The other day my Jupyter notebooks did not start correctly from Anaconda navigator - luckily the Jupyter docs have a section  Jupyter - What to do when things go wrong. So I tried starting it from Anaconda prompt and it indeed gave me an exception that there was an invalid path in the Jupyter config file - to find out where to look for the config file check out Jupyter common directories and file locations

Tuesday, September 20, 2022

Quick tip: updating Anaconda with command prompt

 I recently started getting a popup for updating Anaconda Navigator on my Windows machine and I also received a warning when installing packages using the Anaconda prompt. I first started the update through the user interface but this update completely stalled and I had to do a hard reboot after almost 2 hours (when my patience ran out). Running the update using Anaconda prompt worked without problems - next time I will use this method first. If conda is installed on your machine, you can update it to the most recent version and patches using  conda update -n base -c defaults conda


Sunday, September 18, 2022

Speaking engagements in coming months

With all Covid bans lifted and summer holidays well over, the conference season kicks off. 


I will be speaking at a couple of events in the coming weeks and months:

  • Dataminds evening session Upcoming in-person event on September 29th organized by dataMinds.be at Inetum-Realdolmen offices in Kontich together with Benni De Jagere. First session a little bit off the beaten track for data professionals: #dataviz for investors. Second session: #PowerBI roadmap and #AMA by Benni.
  • Collabdays Belgium 2022. Free community-driven event in Brussels, Belgium. Focus is Microsoft 365 with some Power Platform and Azure sprinkled on top. I am particularly excited to be speaking at this conference which was born out of the SharePoint Saturday conferences which I helped organize many years ago. I will be delivering Dataverse Deep Dive: watch out for sharks.
  • Cloudbrew 2022. A two-day conference focusing on all things Azure on November 18-19 in Mechelen Belgium. I will be delivering Using Python and Azure Cloud for trading and investing

Thursday, September 01, 2022

Dataminds event - How data visualization can help you become a better long-term investor and Power BI roadmap session

I will be delivering a  Dataminds session together with Benni De Jagere (@BenniDeJagere) on September 29th - for registration and info see the Dataminds in-person event at Realdolmen


Below the summary of the session and a sneak peak at the opening slide (spoiler alert: investing like a sloth isn't that hard)

How data visualization can help you become a better long term investor

Summary: Whether you prefer passive investing or are more into actively managing your investments, data visualization can help you overcome the emotional biases associated with investing in the financial markets. In this session, we will explore how you can use Python, Azure and Power BI to become a better long term investor. We will start with gathering the relevant data using Python, process it with Synapse and Python, and finally finish off with building  data visualizations using Jupyter notebooks and Power BI. We will see how these visualizations can help you understand portfolio returns and risk, get a better understanding of market manias and crashes and visualize different investment strategies.

The aim of this session is not to tell you what stocks, bonds, funds or ETFs to buy but will show you how data visualization might help you not to fall for the irrational and manic-depressive characteristics of Mr. Market or other pitfalls when starting to invest.

Attendees are invited to fill in this survey (max. 5 minutes) https://ecv.microsoft.com/pteCfVQ89I – survey results will be used in the session.

Friday, August 26, 2022

Detailed Power Platform request usage information in Power Platform Admin Center in preview

I wrote a post in January 2022 on the changes in Dynamics 365 and Power Platform request limits and allocations mentioning that detailed reporting was not available at that point in time. 

In the meanwhile Microsoft has released Detailed Power Platform request usage information in the Power Platform admin center (Preview). For integration application users you need to look at the Non-licensed User report which shows request usage per day for non-licensed users and the total entitlement for the tenant.  Unfortunately for environments with a lot of integrations you might need to revert to some Excel skills or Power BI to make sense of the data (currently working in a tenant where we have 100K+ lines in the CSV export file).


For the moment there is no high usage enforcement for Power Platform request limits, but this might start at least six months after the reports have been made available. 


References:


Wednesday, August 17, 2022

Dynamics 365 and Power Platform monthly reading list July 2022


Power Platform and Dynamics 365 release 2022 wave 2


Technical topics (Configuration, customization and extensibility)


Topics for Dynamics 365 Business Applications Platform consultants, project managers and power users


Friday, August 12, 2022

Using the yFinance Python package to download financial data from Yahoo Finance - part 2

In a previous post I showed how you can download ticker data from Yahoo Finance using the yFinance Python package.  I now updated the  Jupyter notebook code sample using YFinance to also show how you can retrieve additional information (sector, industry, trailing and forward earnings per share, etc...). The Ticker class in the yFinance library contains the info property which returns a dictionary object ( a collection of key-value pairs where each key is associated with a value) which allows you to access specific information about an asset.

Since I wanted to know how fast data retrieval would be I also include the %%time magic command . Wall clock time measures how much time has passed. CPU time is how many (milli)seconds the CPU was busy.


Yahoo Finance contains data about stocks, Exchange Traded Funds  (ETF), mutual funds and stock market indices - the information that you can retrieve for each of these differs, so it is safe to check in your code for the quoteType. Below example retrieves information about Apple stock, the iShares MSCI AWCI UCITS ETF (Acc) and a thematic mutual fund from KBC.

I also included a code snippet which shows how to retrieve this information for multiple assets and convert this into a Pandas dataframe.