In this walkthrough, I will show how you can perform exploratory data analysis on stock market data using Azure Synapse serverless SQL pools. To simplify things I will just focus on daily quotes for the S&P 500.
The S&P 500 (short for Standard & Poor's 500) tracks the performance of 500 large companies listed on exchanges in the United States. The composition of the S&P 500 is typically rebalanced four times per year. The S&P 500 is a capitalization-weighted index meaning that the stocks with a higher market capitalization have a big impact on the changes in the index (See Top 10 S&P 500 stocks by index weight)

I downloaded all daily data for the S&P 500 stock market index (ticker symbol is ^GSPC) from Yahoo Finance using the historical data tab in CSV format. The S&P CSV file contains the date, open, high, low, close, volume, dividends and stock splits for the S&P 500 from December 1927 (but the index in its current form was only created in 1957) until now (dividends and stock splits are not relevant). I manually downloaded the file but take a look at Using Python and Pandas Datareader to retrieve financial data part 3: Yahoo Finance and Using the yFinance Python package to download financial data from Yahoo Finance for ways to automate retrieving data from Yahoo Finance using Python.
Serverless SQL Pools in Azure Synapse
Walkthrough: analyzing S&P 500 data with Synapse serverless SQL
In this post I will not show you how you need to setup Azure Synapse - take a look at Quickstart: Create a Synapse Workspace for a detailed walkthrough - the Microsoft Learn learning paths which I added in the references are also quite useful.
In this post, I will be primarily using SQL to analyze the data but this is a matter of preference (having a coding background I prefer Python to do exploratory data analysis)
After you downloaded the data you will need to upload the CSV file to the Azure data lake storage associated with Synapse Link (you can also use a different Azure storage).

The OpenRowset (Bulk..) function allows you to access files in Azure storage. The SP500.csv file has a header row specifying the different columns in use - it contains all daily ticker data since December 1927. I am using Parser_Version 2.0 since it is more performant but it has some limitations (see the Arguments section in Microsoft's OpenRowSet documentation) - also check out How do Synapse serverless SQL pools deal with different file schemas (or schema evolution) part 1 CSV for some interesting info on how schema changes are handled.

If you will be using the data quite frequently, it might make more sense to use a CETAS process (CREATE EXTERNAL TABLE AS SELECT) to generate a dataset pointing to the data residing in the data lake ready for querying. In the Synapse Studio data hub, you can simply right click on a file and select the option to create an external table.


- Let's get all closing prices for this century ([date]> '2020-01-01') - you will notice that you can also visualize the data using some basic graphs.

- Which were the years with the largest percentage difference between the highest and lowest close for the S&P 500? No surprises here - we have the Wall Street crash of 1929 followed by the Great Depression of the 1930s, the Financial Crisis of 2007-2008 and the Covid crash in 2020 in the top 10

- Which were the days with the highest difference between the day's closing price and the previous closing price - so the days in which the market crashed. In this example I used the SQL Lag() function. Besides the 1930s we also see Black Monday with a 20% decline in the S&P 500 - this triggered a global sell-off (Take a look at this video about Black Monday documentary (YouTube) with traders actually still working on the market floor)

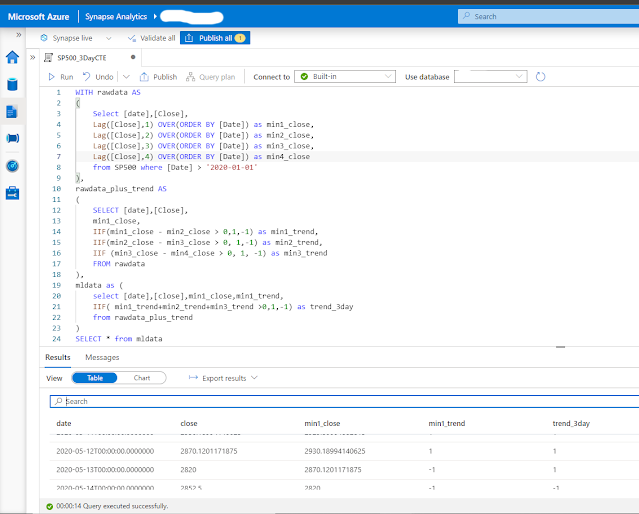
- You can also use common table expressions (CTE) for working with temporary named result sets for more complex queries and data manipulations. In the example below I want to find the 3-day trend for the S&P 500. (See Introduction to the SQL With clause if you are new to CTEs). The idea behind this query is to create a three-day trend variable for any given row. If the closing price on a day is greater than the closing price on the previous day, then we assign that day +1 one, otherwise, that date gets assigned -1 (minx_close columns). If the majority in the previous 3 days consists of positive values, the trend is positive, otherwise the trend is negative. (Example taken from Coursera: Introduction to Trading, Machine Learning & GCP )


References:
- Build data analytics solutions using Azure Synapse serverless SQL pools (Microsoft Learn)
- Microsoft Learn for Data Engineers
- Microsoft Certified: Azure Data Engineer
- How do Synapse serverless SQL pools deal with different file schemas (or schema evolution) part 1 CSV
- DP-203 Data Engineer Lab 02 - Run interactive queries using serverless SQL pools
- SQL Lag function overview and examples
- Black Monday documentary (YouTube) or the news report from Dutch television Zwarte Maandag (Dutch only)
- What is the WITH Clause in SQL
- CTE in SQL and What is a Common Table Expresssion (CTE) and how do you use them ? (YouTube) from @GuyInACube
- Azure Synapse Toolbox
No comments:
Post a Comment