You might already have seen below graph taken from a study by JP Morgan Asset Management, but what if you would like to look at historical returns without going through the hassle of having to collect all the data yourself?
There is an interesting Excel sheet shared by Aswath Damodaran (@AswathDamodaran) that you can download from Historical Returns on Stocks, Bonds and Bills: 1928-2022 which looks at returns of different asset classes (stocks, bonds, bills, real estate and gold) over a longer time period.
In this post I will share some tips on how you can use this data in Power BI, Python and Jupyter notebooks.
This Historical Returns on Stocks, Bonds and Bills: 1928-2023 - Excel file file is updated in the first two weeks of every year and it is being maintained by Aswath Damodaran, who is a professor of Finance at the Stern School of Business at NYU, he is also known as the "Dean of Valuation" due to his experience in this area.
Visualizing S&P 500 and US Treasury bond returns using Power BI
I first converted the Excel from xls to xlsx format and afterwards it is quite easy to
import the data from an Excel workbook files in Power BI . It is quite easy to visualize the returns of both stocks and US treasury bonds using a clustered column chart - I also added a minimum line for both stock and bond returns.
Expected risk and expected return should go hand in hand: the higher the expected return, the higher the expected risk. Risk means means that the future actual return may vary from the expected return (and the ultimate risk is loosing all of your assets). The first visual showed a 20-year annualized return between 1999 and 2018 for the S&P 500 of 5.8%. Average returns hide however the big swings in yearly returns - e.g. in 2008 (the Great Financial Crisis), the S&P 500 had a -36.5% yearly return. Bonds on average have a lower return but also have a lower risk profile.
The basic rule of thumb is to keep your “safe money” (i.e., money you don’t want to risk in stocks) in high-quality bonds. While this doesn’t give you 100% protection against losses at all times, it does provide you some peace of mind. I really like this quote: "If you can't sleep at night because of your stock market position, then you have gone too far. If this is the case, then sell your positions down to the sleeping level. (Jesse Livermoore)"
As you can see in the visualization below, in most years with a negative return for the S&P 500, the return for bonds is positive - with two notable exceptions 1969 and 2022. A common saying is to have your age in bonds. Using that general rule, a 45-year-old might have 45% of the total portfolio in bonds. If you want to more aggressive, you would have less than your age in bonds. The last decade with interest rates very low (or even negative) this probably wasn't a very profitable asset allocation but
things might have shifted.
The US Treasury Bond used in the Excel file is the 10-year US treasury bond for which you can download the data from FRED . The yearly return has been calculated by taking the yield and the price change for a par bond with that specific yield.
In the long run (see example below for different rolling windows from a 1-year to a 20 year period) stocks will outperform bonds but this again works with averages and it ignores the tail risk which might wreak havoc in your portfolio.
Reading data from Excel using Python
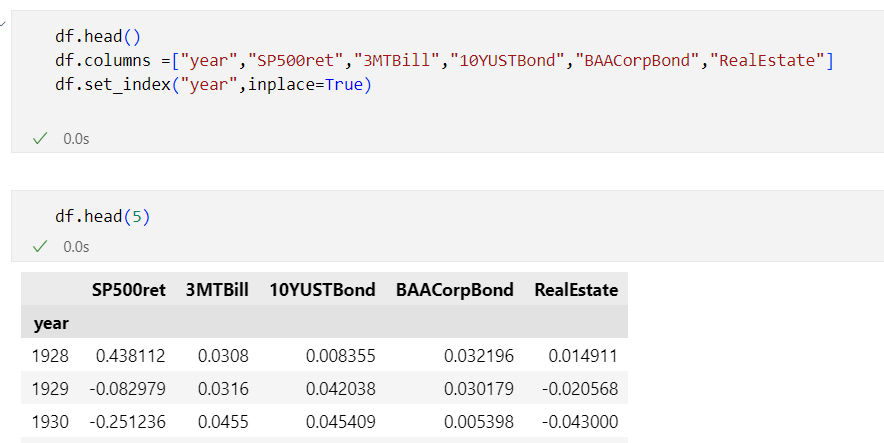
Now let's take a look at how you can read and manipulate the data in this Excel sheet using Python. To read an excel file as a DataFrame, I will use the pandas read_excel() method. Internally, Pandas. .read_excel uses a library called xlrd which you also need to install but I used the
openpyxl library as an alternative which also works. So before you can read an excel file in pandas, you will need to install
- sheet_name: can be an integer (for the index of a worksheet in an Excel file, default to 0, the first sheet) or the name of the worksheet you want to load
- nrows: number of rows to read
- skiprows: number of rows to skip
- usecols: by default all columns will be read but also possible to pass in a list of columns to read into the dataframe like in the example
References:
Related posts: