In this post, we'll learn what Azure Functions are, and how you can use VS Code to write your first Azure Function in Python code.
I will show how you can create a simple Azure Function which retrieves data from Yahoo Finance (See Using Python and Pandas Datareader to retrieve financial data - part 3: Yahoo Finance) and saves the retrieved data in a CSV file in Azure blob storage. I will be using the Python v1 programming model for Azure Functions since v2 is still in preview.
Introduction to Serverless and Azure Functions
More traditional forms of cloud usage require you to provision virtual machines in the cloud, deploy your code to these VMs, manage resource usage and scaling, keep the OS up to date and the underlying stack, setup monitoring, perform backups, etc...
But if you just want to deploy some piece of code which needs to handle some kind of event, serverless compute might be the right choice for you. With serverless compute, you can develop your applications, deploy it to the serverless service like Azure Functions and you don't need to worry about the underlying hosting architecture. Serverless compute is most of the time cheaper than PAAS or IAAS hosting models.
Several versions of the Azure Functions runtime are available - see Languages by runtime version for an overview which languages are supported in each runtime version. Python 3.7, 3.8 and 3.9 are supported by Azure Functions v2, v3 and v4.
How to create an Azure Function using Azure Portal
You can deploy an Azure Function from your local machine to Azure without leaving VS Code, but I would recommend doing it first using the Azure Portal to understand what VS Code is doing behind the scenes.
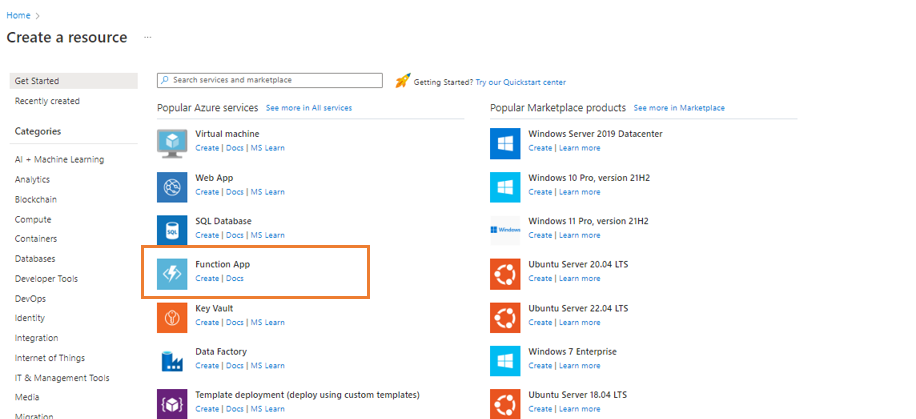
To create your Azure Function, click the Create a resource link on the Azure Portal home page and next select Function App.
This brings us to the function creation screen, where we have to provide some configuration details before our function is created:
- Subscription: Azure subscription in which you want to deploy your Azure Function App
- Resource group: container that holds related resources for an Azure solution - these resources typically share the same development lifecycle, permissions and policies, ...
- Function App Name
- Runtime stack: Python
- Version: choose 3.9 (latest supported version) unless you have specific Python version dependencies.
- Region: choose the same region as other resource that you need to deploy e.g., blob storage, Cosmos DB, etc. ...
- Operating system: only Linux is supported
- Plan type: leave it to Consumption (Serverless) unless you have very specific requirements with regards to execution time limit higher than 10 minutes (see Azure functions scale and hosting - function app timeout duration for more details)
In the next configuration screens just leave the default options but do make sure that you link up an Application Insights resource to your Azure function.
Setup your development environment
Things to setup beforehand:
Create your local Azure Function project in VS Code
Let's now see how you can create a local Azure Functions project in Python - open the Command Palette and choose
Azure Functions: Create function. Next select Python, the Python interpreter to create a virtual environment, the template for the function (HTTP trigger) and the authorization level. Based on the provided information, Visual Studio Code will generate the different files in your project.
When you choose "HTTP trigger", it means that the function will activate when the function app receives a HTTP call. The name that you specified for the Function name (jopxtickerdata) will be used to create a new directory which contains three files:
- function.json - configuration file for our function
- sample.dat - sample data to test the function
- __init__.py - main file with the code that our function runs
You can also add in your own Python code files (e.g. jopxlib.py) that you can use afterwards __init__.py , see
Azure Functions Python developer guide - Import behavior for more details.
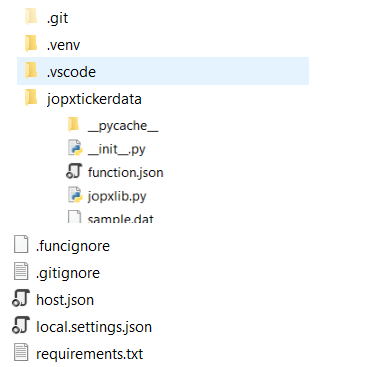
In the root directory of your project you will also see other files and folders:
- local.settings.json: stores app settings and connection strings when running locally
- requirements.txt: list of Python packages the system installs when publishing to Azure
- host.json: configuration options that affect all functions in a function app instance
- .venv: folder which contains the Python virtual environment used by local development.
I slightly modified the standard generated HTTP trigger so that it accepts 2 query string parameters (name and startdate), added a reference to my own Python code (jopxlib) and called the writetickertoazblob function within the main function.
The code of writetickertoazblob is quite simple - it will download data from Yahoo Finance in a dataframe and then save the dataframe to CSV and upload it to Azure Blob Storage. in Azure functons, application settings are exposed as environment variables during execution os.environ["AZURE_STORAGE_CONNECTION_STRING"] will read the application setting with name AZURE_STORAGE_CONNECTION_STRING